Overview
The .NET MAUI Circular Charts control includes functionality for plotting three chart types. Each chart type is easily configured with built-in support for creating stunning visual effects.
Circular charts

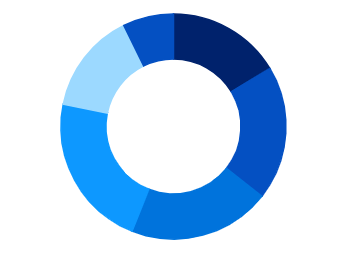
.NET MAUI Doughnut chart
A doughnut chart is similar to the pie chart, but with an open space at the center. It is intended for comparing the contribution of each data point to the whole.

.NET MAUI Radial bar chart
Renders as circular bars, and is used to show comparisons between categories.