React Gantt Chart - Evaluation Guide
Evaluate the Syncfusion React Gantt Chart for Enterprise Adoption
The Syncfusion React Gantt Chart provides project planning, scheduling, dependency management, resource allocation, milestone tracking, and timeline visualization capabilities for modern applications. This guide consolidates the key technical and operational considerations required for enterprise evaluation, helping teams assess architecture compatibility, integration flexibility, performance characteristics, security posture, and compliance readiness.
Quick evaluation framework
Evaluate each area in sequence to validate technical fit, operational readiness, scalability expectations, and organizational requirements before making an adoption decision.
| Order | Evaluation area | What to assess | How to verify | Decision impact |
|---|---|---|---|---|
| 1. | Runtime fit | Framework compatibility, supported version alignment, browser-based behavior, and any SSR or hydration considerations | Confirm the target application stack matches supported usage patterns and validate the component in the actual runtime path. | Identifies early whether the component fits the technical platform baseline. |
| 2. | Build and application fit | Package integration, module setup, theming, state management, testability, CI/CD alignment, and compatibility with the existing app architecture | Install the component in the real application repository and run the normal build, test, and deployment pipeline. | Reveals expected implementation and integration effort. |
| 3. | Data and workflow fit | Task hierarchy, dependencies, editing behavior, resource mapping, API integration, authentication flow, and any required business-specific extensions | Connect the component to a production-shaped API and implement a representative planning scenario. | Confirms whether the component supports the required planning and business workflow model. |
| 4. | Performance fit | Large task volumes, deep hierarchy rendering, long timeline ranges, update frequency, remote data loading, and export behavior | Run repeatable workload and rendering tests on target hardware using realistic datasets. | Determines whether the component meets scale and responsiveness expectations. |
| 5. | Security and governance fit | Data handling boundaries, CSP compatibility, export controls, compliance expectations, licensing review, procurement requirements, and support readiness | Validate runtime behavior with browser tools and review internal governance, security, and procurement requirements. | Clarifies organizational readiness and any controls the application must enforce. |
| 6. | Final decision | Verified fit, known limitations, required mitigations, evidence collected, ownership, and unresolved risks | Record pass, conditional pass, or fail for each mandatory area and summarize next actions. | Prevents broad feature coverage from masking a critical adoption gap. |
AI integration and responsibility
The Gantt Chart supports AI-assisted planning through extensibility points such as custom taskbar renderers, toolbar extensions, and event hooks. AI-based task prioritization and progress prediction can be implemented as application-level capabilities, enabling organizations to incorporate AI-driven insights into project planning and scheduling workflows.
AI responsibility boundary: The Gantt Chart does not include an AI runtime or communicate with external AI services. AI capabilities are implemented through the application’s own back-end services or model endpoints.
1
Architecture compatibility
Before evaluating planning and scheduling capabilities, confirm that the Syncfusion React Gantt Chart aligns with your existing technology stack and engineering practices. This section helps assess framework support, build and deployment compatibility, architectural integration, and testing readiness to ensure a smooth adoption process.
Framework and runtime compatibility
Review framework support, React version compatibility, rendering behavior, and browser coverage to establish platform readiness for adoption.
Framework and environment support
Identify the deployment environments supported by the Gantt Chart and understand how it integrates across different application architectures.
| Deployment Environment | Syncfusion React Gantt Chart Coverage |
|---|---|
| React 18/19 SPA | Supported and works with standard configuration. |
| Next.js App Router | Supported. Requires client component usage with documented guidance. |
| Next.js Pages Router | Fully supported. Stable on all Pages Router versions. |
| Vite SPA | Fully supported. Integrates as a standard package dependency. |
| Remix | Fully supported. Client-side hydration behavior is documented and reliable. |
| Gatsby SSG | Fully supported. Has static generation and hydrates correctly at runtime. |
| Electron | Supported. Runs inside Electron's renderer process as a standard React component. |
| Micro-Frontend (Module Federation) | Supported. Declare as a shared singleton at the shell level; one version loads across all teams. |
| Micro-Frontend (Single-SPA) | Supported. Runs as a standard, client-rendered React component inside Single-SPA. |
| Preact | Fully supported. The Gantt Chart works via Preact's React‑compat compatibility layer. |
Use the published system requirements when validating compatibility with the target environment.
React version compatibility
Match the application React version with the documented Syncfusion compatibility requirements before planning upgrades.
| React Version | Syncfusion Minimum Version | Approximate Release Year | Coverage |
|---|---|---|---|
| React 16 | Syncfusion v16 | 2018 | Fully supported and documented in the current release. |
| React 17 | Syncfusion v18 | 2020 | Fully supported and documented in the current release. |
| React 18 | Syncfusion v20 | 2022 | Fully supported and documented in the current release. |
| React 19 | Syncfusion v29 | 2024 | Confirmed compatible in the latest release notes. |
| React Strict Mode | No minimum version constraint. | — | Fully compatible. No double-invoke or duplicate state mutation issues in development Strict Mode. |
| Organization-pinned React version | N/A | — | No peer dependency conflicts. The Gantt Chart consumes the host application's React version. |
| Future React major version planning | Reviewable in release history. | — | Historical adoption pace across React 17, 18, and 19 provides evidence-based upgrade planning. |
Keep all @syncfusion packages at or above the mapped minimum version when upgrading React. Review current release documentation to verify support for newer React versions.
SSR and server component integration
The Gantt Chart uses the documented client-component boundary in Next.js App Router and can initialize from server-prepared data. Follow the documented integration patterns for routing, data loading, and hydration.
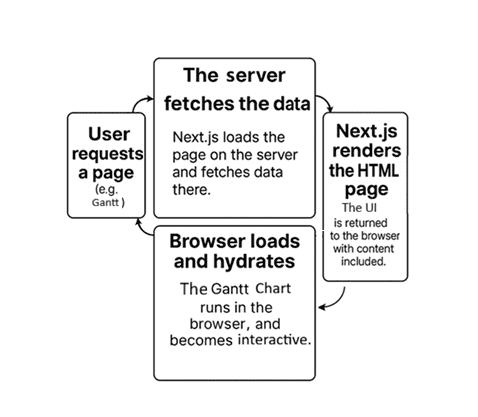
- Data-ready initialization: prepare only the required Gantt data before the client component initializes.
- Hydration boundary: place the Gantt Chart inside a client component to prevent App Router hydration mismatches.
- Streaming SSR: use a Suspense boundary so surrounding content can stream while Gantt data initializes asynchronously.
- Incremental Static Regeneration: ISR-regenerated pages can hydrate without Gantt-specific handling when standard patterns are followed.
- Edge runtime: the Gantt Chart has no Node.js-only runtime dependencies that would block Edge deployment.
Browser and runtime support
Syncfusion publishes a versioned browser compatibility matrix with every release, covering supported modern browsers along with accessibility, high-contrast rendering, and legacy browser considerations.
| Browser Runtime | Syncfusion React Gantt Chart Coverage |
|---|---|
| Chrome (latest) | Fully supported |
| Firefox (latest) | Fully supported |
| Safari (latest) | Fully supported |
| Microsoft Edge (latest) | Fully supported |
| Opera (latest) | Fully supported |
| Internet Explorer 11+ (EOL — June 2022) | Supported when the ES6 Promise polyfill is added, as noted in the documentation. |
Build, package, and module compatibility
Evaluate how the Gantt Chart integrates with existing build systems, module formats, and distributed application architectures.
Build compatibility
The Gantt Chart installs as a standard npm package and integrates with existing build systems without requiring additional configuration or proprietary plugins. Only imported feature modules are included in the production bundle, while unused modules are excluded during the build process.
| Environment/Toolchain | Syncfusion React Gantt Chart Support |
|---|---|
| Webpack | Fully supported. Works as a standard npm/ESM React package with no custom plugins required. |
| Vite | Fully supported. ESM-compatible, integrates without configuration. |
| Turbopack | Supported via ESM export. Core rendering and data binding validated by Syncfusion under Turbopack's production pipeline. No Turbopack-specific plugin required. Teams should verify their own CSS strategy and SSR/Suspense configuration. |
| Nx / Turborepo (Monorepo) | Fully supported. Standard npm dependency declaration; no custom executors, generators, or monorepo-specific configuration required. |
TypeScript Strict Mode ("strict": true) |
Fully compatible. All public APIs, props, and event signatures are fully typed; no @ts-ignore suppressions required for standard usage. |
| Next.js (App & Pages Router) | Supported. Client-component usage where needed. |
| Create React App (legacy — deprecated) | Supported for existing projects. For new projects or migrations, Vite is the recommended replacement. The Gantt Chart's Vite integration guide applies directly with no gantt-chart-level changes required. |
Package distribution and module support
Confirm that the available package and module formats align with the application’s build, testing, and deployment toolchain.
| Module Format | Support | Notes |
|---|---|---|
| ESM | Fully supported | Ships as the primary format (dist/es6). Used by default in Vite, Next.js, and Webpack 5 builds. |
| CJS (CommonJS) | Supported | Compatible with legacy Node toolchains, Jest, and CommonJS-based module loaders such as RequireJS and SystemJS. |
| UMD | Fully supported | Available as dist/[package-name].umd.min.js. Loadable in browsers via script tag, AMD, and CommonJS loaders. |
Inspect package contents on the npm package page.
Micro-frontend and Module Federation compatibility
Micro-frontends can load the Gantt Chart as a standard React dependency. Shared singleton configuration helps prevent bundle duplication, maintain version consistency, and simplify dependency management across independently deployed applications.
| Micro-Frontend Scenario | Coverage |
|---|---|
| Multiple Gantt charts on the same page | Each instance maintains independent state with no cross-instance interference. |
| Module Federation shell (Webpack) | Shared dependency configuration is documented. Prevents bundle duplication and version conflicts across micro-apps. |
| Vite Module Federation | Supported via @originjs/vite-plugin-federation — shared singleton configuration applies identically to Webpack MF. |
| Lazy-loaded route (React.lazy) | Compatible. No special configuration required. |
Application architecture integration
Application architecture is shaped by how the Gantt Chart integrates with existing state management approaches and design systems without introducing additional architectural constraints.
State management neutrality
The Gantt Chart does not depend on any specific state management approach. Data is supplied through props and user interactions are emitted as events. Redux, Zustand, TanStack Query, MobX, Jotai, Recoil, and React Context all integrate without conflict. No global store, context provider, or proprietary data layer is required.
Theming and design system integration
Assess how the Gantt Chart aligns with the organization’s design system, branding requirements, theming strategy, and UI consistency standards.
| CSS Strategy | Coverage |
|---|---|
| CSS custom properties / design tokens | Supported. The Gantt Chart exposes CSS variables for design token overrides. |
| Sass / SCSS variable override | Supported. Themes are built in SCSS and customizable through Theme Studio. |
| CSS Modules | Supported. Preventing global style conflicts. |
| Runtime multitenant theme switching | Partially supported, CSS file or class swaps work for basic scenarios; full brand customization requires Theme Studio. |
| Dark mode | Built-in dark variants for all themes with no custom CSS required. |
| Theme Studio | Supported. Exports SCSS/CSS without touching component source code. |
| Brand / design system alignment | Supported. CSS variables and SCSS tokens cover typography, color, and spacing alignment. |
The Gantt Chart includes 22 built-in themes, including Fluent 2, Material 3, Bootstrap 5.3, and Tailwind 3. Theme Studio supports SCSS/CSS customization, enabling alignment with organizational branding and design-system requirements.
CI/CD and testing compatibility
Assess how the Gantt Chart integrates with existing testing frameworks, automation practices, and release workflows to support reliable delivery and ongoing validation.
CI/CD pipeline compatibility
The Gantt Chart works with standard React testing tools without requiring custom polyfills or separate test environments and can be validated using existing build, test, and deployment pipelines.
Testing framework compatibility
Use the current team toolchain and confirm that standard DOM locators and browser automation cover task editing, dependency changes, virtualization, splitter behavior, and export.
| Testing Tool | Compatibility | Notes |
|---|---|---|
| Jest | Fully supported | Blog reference |
| Vitest | Fully supported | Works with jsdom and happy-dom environments |
| React Testing Library | Fully supported | Standard DOM queries work. No Syncfusion-specific selectors needed. |
| Cypress | Fully supported | E2E tests run against Gantt Chart interactions without custom configuration. |
| Playwright | Fully supported | Gantt Chart elements accessible via standard locators. |
| Storybook | Supported | Gantt Chart renders correctly for visual regression testing. |
Try live demo and navigate to the Testing tab to explore testing approaches and validate implementations using code examples and test cases.
2
Integration and extensibility
Application ecosystems often require integration with project data, business workflows, state management, and distributed architectures. This section examines the available integration patterns and extensibility points provided by the Gantt Chart.
Data and back-end integration
Understand how the Gantt Chart integrates with APIs, data platforms, and authentication workflows through established application integration patterns.
Data source integration
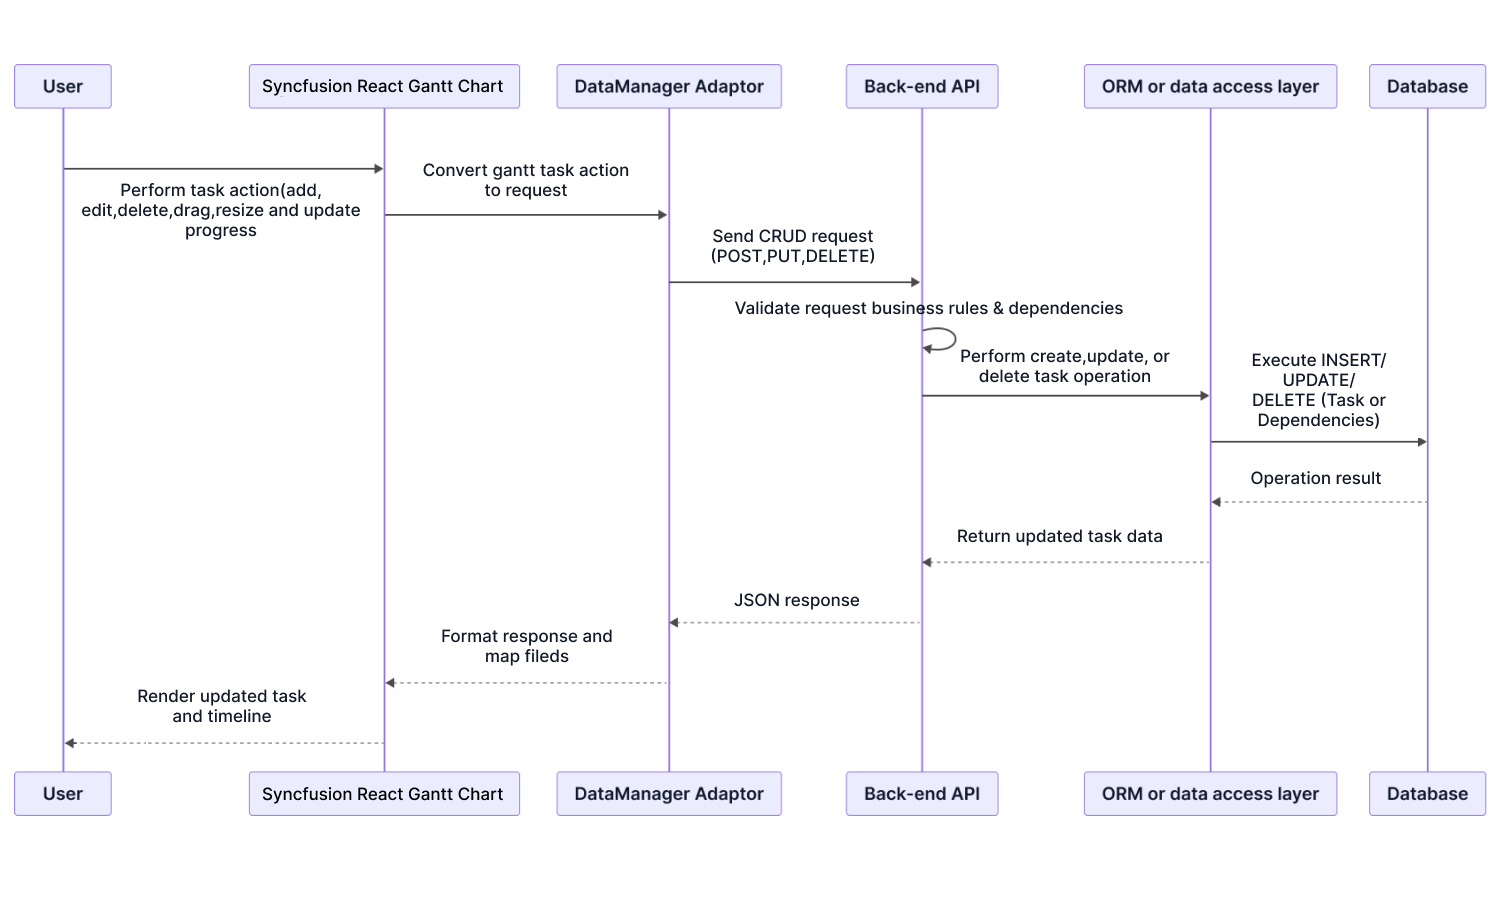
The DataManager and adaptor layer translates data loading, task updates, and dependency changes into the back-end contract, and maps responses into a format the Gantt Chart can render. Built-in adaptors minimize or eliminate manual request and response handling. Select the adaptor that matches the existing API.
| Adaptor | When to use | Enterprise benefit |
|---|---|---|
| URL adaptor | Back end exposes standard REST APIs. | Works with any back-end technology; compatible with microservice and cloud-native architectures. |
| Web API adaptor | Back end is built on ASP.NET web API. | Provides optimized request and response handling for .NET enterprise applications and offers native alignment with the Microsoft ecosystem. |
| Custom adaptor | API follows a nonstandard or proprietary format. | Full control over request and response shaping; allows extending any built-in adaptor without building from scratch. |
Custom adaptors can reshape proprietary requests and responses, map fields, and attach per-request headers or tokens without requiring an adaptor to be built from scratch.
Try live demo and navigate to the Integration tab, then select Adaptors chip to explore available data adaptors and their configuration patterns.
Back-end framework coverage
The Gantt Chart communicates through APIs, so framework fit depends on endpoint shape rather than server technology.
| Back end | Recommended adaptors | Reason |
|---|---|---|
| Django REST framework | URL adaptor, custom binding | Django REST framework exposes standard REST endpoints, so the URL adaptor maps directly and the custom binding handles non-standard field formats or auth schemes. |
| Express and Node.js | URL adaptor, custom binding | These back ends support REST-based APIs, and the adaptor selection depends on the endpoint type exposed by the service. |
| FastAPI | URL adaptor, custom binding | FastAPI exposes standard REST endpoints; the custom binding covers nondefault response envelope formats. |
| Flask and Flask API | URL adaptor, custom binding | Flask and the Flask API are REST-based by default; the custom binding handles lightweight or nonstandard API conventions. |
| Next.js API routes | URL adaptor, custom binding | API routes behave as REST endpoints, so the URL adaptor applies directly. A custom binding can be used when request or response formats require transformation, such as custom field mapping or token handling. |
| ASP.NET web API | Web API adaptor, URL adaptor | The web API adaptor is optimized for .NET response conventions. The URL adaptor applies where REST-only patterns are used. |
Database integration
The Gantt Chart does not connect to databases from the client side. All data access goes through back-end API endpoints.
| Database | Possible adaptors |
|---|---|
| Microsoft SQL Server | URL adaptor, Web API adaptor, Custom adaptor |
| MySQL | URL adaptor, Custom adaptor |
| PostgreSQL | URL adaptor, Custom adaptor |
| SQLite | URL adaptor, Custom adaptor |
ORM compatibility
Any ORM can be used when the API endpoint satisfies the adaptor request and response contract, including Entity Framework Core, Hibernate/JPA, Django ORM, SQLAlchemy, Sequelize, Prisma, Laravel Eloquent, Dapper, ADO.NET, raw SQL, and stored procedures.
Authentication passthrough
Authentication headers are configured through the application data layer and applied to Gantt Chart requests, including data loading, task updates, and scheduling operations. Identity management, authorization, retry policies, and login redirects remain the responsibility of the application.
| Authentication method | Implementation |
|---|---|
| JWT bearer token | Configured in the DataManager and attached to every request. |
| OAuth 2.0 (PKCE and client credentials) | Token supplied by the application authentication layer and injected via DataManager headers. |
| Token refresh | Handled via the DataManager request interceptor. |
| Mutual TLS (mTLS) | Configured at the HTTP transport layer, which is below the DataManager boundary. |
| Auth failure (401/403) | Surfaces via built-in failure event and the retry, redirect, and notification logic remain in the application layer. |
See custom headers and DataManager middleware logic for more information.
API stability and extensibility
Determine whether the Gantt Chart provides the long-term stability, customization flexibility, and developer control required for enterprise application workflows.
Versioning and API stability
The Gantt Chart follows semantic versioning. Public properties, events, methods, and template APIs are part of the stable public API surface.
| Change type | Policy |
|---|---|
| Breaking changes | Introduced only in major versions; not included in minor or patch releases. |
| New properties, events, and methods | Added in minor versions; backward compatible. |
| Deprecations | Deprecated members remain functional through the deprecation window and are flagged with TypeScript @deprecated annotations. |
| Major version upgrades | Accompanied by a migration guide with before and after examples scoped to the published breaking change list. |
Extensibility model
The Gantt Chart exposes presentation, visualization, time-axis, interaction, and toolbar extension points through documented APIs. Custom templates are rendered through React, and applications should sanitize any user-provided content rendered within them.
Presentation layer
| Extension point | What it replaces | Common use |
|---|---|---|
| Column template | Default column cell rendering | Customize the rendering of task-related data fields within the tabular view based on business context. |
| Header template | Default column header | Modify header content with contextual information to make the tabular view easier to understand. |
Visualization layer
| Extension point | What it replaces | Common use |
|---|---|---|
| Taskbar template | Default taskbar UI | Visually distinguish tasks based on their type or progress. |
| Parent taskbar template | Default parent task rendering | Clearly separate summary tasks from individual tasks. |
| Task label template | Default task label text | Display task-related information near the timeline. |
| Milestone template | Default milestone marker | Customize milestone appearance. |
Time-axis layer
| Extension point | What it replaces | Common use |
|---|---|---|
| Timeline template | Default timeline cells | Adjust how time periods are displayed to match business reporting needs. |
Interaction layer
| Extension point | What it replaces | Common use |
|---|---|---|
| Taskbar tooltip template | Default taskbar tooltip | Show additional task details when users hover over a task. |
| Baseline tooltip template | Default baseline tooltip | Provide planned vs. actual information during interaction. |
| Connector line tooltip template | Default dependency tooltip | Display task relationship details. |
| Timeline tooltip template | Default timeline tooltip | Provide contextual information about time periods. |
| Editing tooltip template | Default editing tooltip | Shows real-time feedback while adjusting tasks. |
Toolbar layer
| Extension point | What it replaces | Common use |
|---|---|---|
| Toolbar template | Default toolbar UI | Integrate custom actions and workflows into the command surface. |
Try live demo and navigate to the Integration tab, then select Extensibility chip to access related resources and examples.
Programmatic API: Events and methods
The event and method APIs provide control over task lifecycle, dependencies, scheduling, navigation, selection, layout, export, state, localization, and audit workflows before, during, and after execution.
| Capability | Architectural implication |
|---|---|
| Pre-execution interception | Selected pre execution lifecycle and interaction events are interceptable, with cancellation support where exposed by the API. |
| Task lifecycle management | All task lifecycle operations, such as add, edit, delete, save, and validation, are interceptable, and changes are committed only after application approval. |
| Programmatic data operations | Tasks and dependencies can be created, updated, or removed directly from application logic without user interaction. |
| Scheduling and dependency control | Built-in scheduling can be overridden to enforce custom planning rules and dependency constraints. |
| User interaction control | Drag, resize, and other task interactions can be monitored and modified in real time to prevent invalid updates. |
| Hierarchical data control | Parent-child task structures can be expanded, collapsed, or loaded as needed, supporting large and complex project hierarchies. |
| Programmatic scrolling and focus | The Gantt Chart viewport can be programmatically scrolled to specific tasks or timeline positions, improving navigation in large datasets. |
| Timeline and navigation control | Timeline range, zoom, and navigation can be dynamically adjusted based on context or user role. |
| UI state and selection control | Selection, expansion, and UI state can be managed externally, enabling coordination with other components. |
| Layout and configuration control | Columns, views, and layout can be changed at runtime without reinitializing the component. |
| Command surface extensibility | Toolbar and context menu actions can be extended or replaced to integrate custom workflows. |
| Performance and data handling | Virtualization and lazy loading ensure scalability while still allowing application-level control. |
| Exporting and reporting | Data can be exported programmatically to Excel, CSV, or PDF for reporting workflows. |
| Undo, redo, and action tracking | Built-in history tracking reduces the need for custom state management for user actions. |
| Loading state control | Loading indicators can be managed independently, ensuring a smooth user experience during data operations. |
| State persistence | Basic UI state (sorting, filtering, layout) can persist across reloads, with advanced state handled by the application. |
| Viewport-responsive layout | Gantt Chart layout and dialogs adapt to mobile and tablet viewports at the configuration level, and no separate responsive implementation is required. |
| Regional and language adaptation | RTL rendering, locale-aware formatting, and all UI string translations are configurable at the component level. |
| Keyboard and accessibility control | Full keyboard navigation is built in, and keyboard events are exposed for custom interaction handling and accessibility compliance. |
| Audit and change tracking | Task modification events provide old and new values with full task context, making them directly consumable for audit logging and compliance systems. |
| Instance isolation | Each Gantt Chart instance exposes an independent API surface and state is managed independently for each instance. |
Explore the versioned Event API, Method API, and feature-rich interactive sample to evaluate programmatic capabilities and customization options.
State management integration
The Gantt Chart integrates with existing state management patterns while preserving established application data flows and ownership boundaries.
State management compatibility
The Gantt Chart integrates with existing state management libraries and query layers without requiring changes to established application data flows or ownership boundaries.
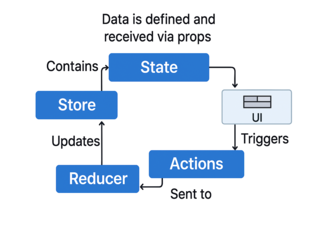
Compatibility matrix
Review how the Gantt Chart integrates with common state management libraries and query layers used in React applications.
| State library | How the Gantt Chart connects |
|---|---|
| Redux and Redux Toolkit | Store value is passed as a data source and the dispatch is called inside the Gantt Chart's event handlers. |
| Zustand | Zustand store slice is passed as a data source and the Gantt Chart consumes it, but never writes to the store. |
| TanStack Query and RTK Query | Query result is passed as a data source and the Gantt Chart triggers a re-fetch via a built-in change event. |
| React Context | Context value is passed as a data source. No provider wrapping is required inside the Gantt Chart. |
| MobX | Observable is passed as a data source and the Gantt Chart re-renders on observable change. |
| Jotai and Recoil | Atom value is passed as a data source, following the standard React data flow. |
Try live demo and navigate to the State management tab to explore different integration patterns and verify data flow in real time.
Multi-Gantt and micro-frontend integration
Understand how the Gantt Chart behaves across distributed application architectures, including parallel instances, independently deployed modules, and coordinated application experiences.
Multi-Gantt runtime behavior
Multiple Gantt Chart instances do not share configuration, data, events, adaptors, or lifecycle state unless the application explicitly coordinates them.
| Runtime concern | How the Gantt Chart behaves |
|---|---|
| State isolation between instances | Each Gantt Chart instance maintains an independent configuration, data source, and lifecycle. Actions in one Gantt Chart do not affect another. |
| Cross-Gantt coordination | Coordination between Gantt Chart instances is handled entirely through the application's state layer. The Gantt Chart provides the event and method surface; the application owns the coordination logic. |
| Multi-Gantt dashboard composition | Multiple Gantt Chart instances run simultaneously on the same page. Each renders and scrolls independently with no cross-instance event leakage. |
Micro-frontend runtime behavior
At runtime, the Gantt Chart remains within its micro-frontend module boundary. Lazy loading and independent module lifecycles are supported, while version conflict policy remains a shell-level concern.
| Runtime concern | How the Gantt Chart behaves |
|---|---|
| Micro front-end module boundaries | The Gantt Chart operates as a self-contained React component. It can be added, updated, or removed from a module without affecting other modules in the shell. |
| Lazy-load compatibility | The Gantt Chart loads inside React.lazy and Suspense boundaries without hydration errors. It is compatible with on-demand, module-based loading to enable Gantt Chart features in MFE shells. |
| Independent upgrade path | Each module can upgrade its Gantt Chart version independently when the shell enforces a shared singleton. Version conflicts are resolved at the shell level, not at the module level. |
Explore the micro front-end architecture blog to understand how micro-front-end architectures are used in modern applications.
3
Performance and scalability
Enterprise project planning solutions must remain responsive as task volume, dependency complexity, timeline range, and user activity increase. This section examines rendering and data-processing efficiency, benchmark-based performance validation, and real-time update behavior to assess scalability across large and dynamic project environments.
Rendering and data processing performance
Examine how the Gantt Chart manages large datasets, balances client and server processing, and maintains efficient rendering and responsive user experiences at scale.
Rendering performance modes
Select rendering modes based on task volume, hierarchy depth, and timeline range. Each mode is designed for specific data access patterns, including large task datasets, wide multiyear timelines, incremental child loading, and server-driven operations.
| Rendering mode | Typical data scenario | What it prevents | Architectural outcome |
|---|---|---|---|
| Row virtualization | Large task datasets with vertical scrolling. | Full task list rendering in the DOM at once. | DOM size remains bounded to the viewport and does not grow proportionally with task count—browser memory and scroll performance are unaffected by dataset growth. |
| Timeline virtualization | Wide date-range projects with horizontal scrolling. | All timeline header cells rendering regardless of visibility. | Rendered timeline DOM remains bound to the visible viewport—multiyear timelines do not cause layout recalculation cost or horizontal scroll degradation. |
| Load child on demand | Deep hierarchical projects with large child sets. | All child records loading upfront on initial render. | Parent expansion is the trigger for child fetching. Initial load is unaffected by total child dataset size. |
| Disable date scheduling validation | Bulk initial load of prevalidated project data. | Automatic predecessor and parent-child date validation during initial load. | Initial parsing and rendering can be faster for prevalidated imports; scheduling validation is deferred and performed only during user-triggered edit actions. |
Server-side operations
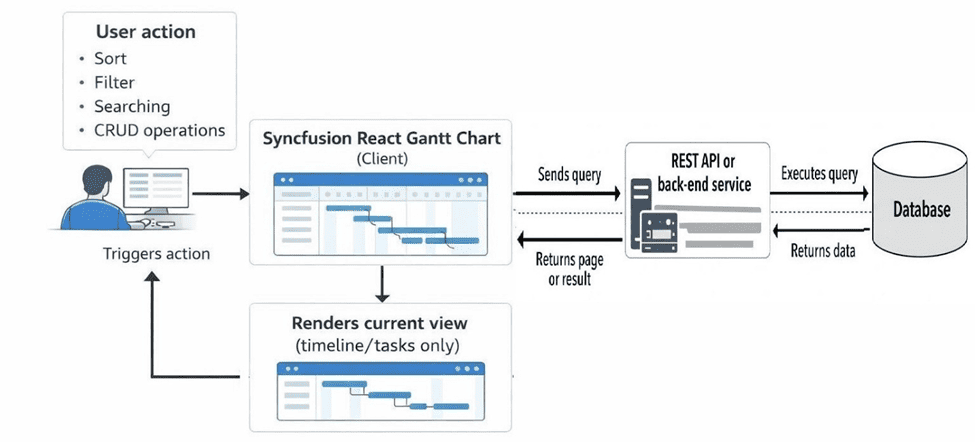
Server-executed operations keep authoritative project data on the back-end and avoid full hierarchy transfer when it is not permitted or practical. The Gantt Chart requests only the data required for the current view while delegating persistence and computation to the back-end system.
| Server-side operation | Syncfusion React Gantt Chart coverage | Architectural benefit |
|---|---|---|
| Initial data load | Task data requested from API on component mount; back end returns only the required records. | Reduces payload size and prevents full project dataset transfer to the browser. |
| CRUD operations | Add, edit, and delete actions submitted to back-end API endpoints via batch URL. | Maintains authoritative server-side data integrity and project audit trail. |
| Load child on demand | Child task records fetched from the server only when a parent node is expanded. | Prevents full hierarchy transfer on load; only the visible branch is fetched. |
| Filtering | Filter predicates sent to the back-end API. | Offloads filtering to the data source and avoids client-side full dataset loading. |
| Sorting | Sort descriptors transmitted to the API for server-side execution. | Enables database-level sorting for project datasets beyond client memory limits. |
DOM efficiency
The Gantt Chart uses viewport-based rendering to keep the DOM footprint bounded. The left panel renders the task hierarchy as a tree grid, while the right panel renders the timeline. Only visible task rows, timeline cells, and required structural elements are present in the DOM, regardless of the total number of tasks or project date span. This approach helps control browser memory usage, reduces layout recalculation costs, and maintains consistent scrolling performance for large projects.
| Dataset size | Standard HTML table | Syncfusion React Gantt Chart (virtualization enabled) |
|---|---|---|
| 100 tasks in 5 columns | ~500–1,000 DOM nodes (rows, columns, and structural elements) | ~100–250 DOM nodes (viewport rows, columns, and structural elements) |
| 1,000 tasks in 5 columns | ~5,000–10,000 DOM nodes | ~100–250 DOM nodes, constant regardless of task count |
| 5,000 tasks in 5 columns | ~25,000+ DOM nodes, causing significant browser slowdown | ~100–250 DOM nodes, unchanged even at large scale |
| 10,000 tasks in 5 columns | Browser typically becomes unresponsive due to DOM size | ~100–250 DOM nodes, unchanged even at very large scale |
Note: DOM behavior can be directly observed through browser developer tools.
Performance benchmarking and validation
Review the available performance evidence, testing conditions, and reference workloads used to evaluate scalability and operational responsiveness.
Benchmark scenario
Syncfusion publishes performance benchmarks for the React Gantt Chart that demonstrate rendering behavior under large-scale workloads across different task structures, dependency configurations, resource views, and feature combinations. These scenarios provide reference points for scalability planning and performance evaluation.
| Benchmark scenario | What the benchmark measures | Architectural relevance |
|---|---|---|
| Initial load, parent-child with validation | Time required to render the task hierarchy with scheduling validation enabled. | Establishes baseline initial-render performance. |
| Initial load, parent-child with dependency | Time required to render tasks and predecessor relationships during initial load. | Demonstrates dependency-resolution cost at scale. |
| Initial load, parent-child, dependency, and resources | Time required to render tasks, dependencies, and resource assignments. | Reflects combined dependency and resource-binding overhead. |
| Initial load, parent-child, dependency, and split-taskbar | Time required to render tasks with dependencies and split-taskbar segments. | Evaluates rendering cost for advanced scheduling scenarios. |
| Initial load, dependency, split-taskbar, resources, without validation | Time required to render all feature combinations with scheduling validation disabled. | Demonstrates the performance impact of disabling validation for prevalidated imports. |
| Initial load, resource view | Time required to render the resource-grouped view. | Measures the cost of resource-centric project visualization. |
| Initial load, resource view with dependency | Time required to render resource-grouped tasks with predecessor relationships. | Evaluates the combined impact of resource grouping and dependency rendering. |
Testing environment
- Component: Syncfusion React Gantt Chart (2026 Volume 1, 33.1.44)
- Framework: React (production build)
- Browser: Google Chrome 122.x (Blink rendering engine)
- Operating system: Windows 11 (64-bit)
- Hardware: AMD Ryzen 5 7520U processor, 16 GB RAM, AMD Radeon graphics
- Dataset: 25,000 task counts.
- Measurement methodology: Performance timings were measured using the Gantt Chart action lifecycle events, capturing the duration from operation start to completion of the corresponding UI update.
Disclaimer: Actual performance may vary based on hardware, browser version, viewport size, dataset shape, and application configuration.
Benchmark results
The following results demonstrate React Gantt Chart performance across multiple 25,000-task scenarios, including dependencies, resources, split-taskbars, validation modes, and resource views.
| Data load configuration | 25K tasks - Initial Load (sec) | Searching (ms) | Sorting (ms) | Clear sorting (ms) | Filtering (ms) | Clear filtering (ms) |
|---|---|---|---|---|---|---|
| Parent, child, auto validation | ~4.0 | ~323 | ~281 | ~255 | ~114 | ~186 |
| Parent, child, dependency | ~7.5 | ~293 | ~168 | ~105 | ~92 | ~122 |
| Parent, child, dependency, resources | ~8.4 | ~323 | ~193 | ~111 | ~176 | ~131 |
| Parent, child, dependency, split-taskbar | ~20.7 | ~320 | ~188 | ~126 | ~157 | ~131 |
| Parent, child, dependency, split-taskbar, resource, without validation | ~15.3 | ~384 | ~170 | ~120 | ~192 | ~141 |
| Resource view | ~39.7 | ~439 | ~316 | ~208 | ~280 | ~251 |
| Resource view, dependency | ~49.5 | ~613 | ~390 | ~278 | ~380 | ~358 |
Try live demo and navigate to the Performance tab to view and validate live performance metrics.
Real-time performance and scalability
Evaluate how the Gantt Chart maintains responsiveness during ongoing updates and adapts to increasing project complexity across diverse workload characteristics.
Real-time update performance
The Gantt Chart provides targeted APIs for task updates, insertion, and deletion. Changes can be applied incrementally without rebuilding the entire project view, helping minimize rendering overhead and maintain UI responsiveness during continuous updates.
| Real-time scenario | Syncfusion React Gantt Chart coverage | Rendering behavior |
|---|---|---|
| Single task progress update | Row-level update handling supported via updateRecordById | Only the targeted taskbar row re-renders while minimizing unnecessary full re-render cycles. |
| Add new task at runtime. | Fully supported via addRecord | Single row inserted at the specified position; no full re-render. |
| Delete task at runtime. | Fully supported via deleteRecord | Row removed; predecessor connector lines recalculated only for affected tasks. |
| Real-time updates with row virtualization | Fully supported | Only visible rows participate in rendering; off-screen rows remain virtualized |
| Taskbar drag-and-drop during live updates. | Fully supported | Primarily the dragged task and affected dependencies update; rest of the chart remains stable. |
| Streaming updates with large task datasets. | Fully supported | Updates applied incrementally to in-memory data source without rebuilding the full hierarchy. |
Scalability beyond task count
Enterprise scalability depends on multiple workload characteristics, including timeline span, hierarchy depth, column volume, project structure, resources, concurrent instances, export size, and dynamic schema changes.
| Scalability dimension | Syncfusion React Gantt Chart coverage | Architectural behavior |
|---|---|---|
| Task count | Row virtualization scales to tens of thousands of tasks. | Only visible rows participate in rendering, limiting DOM growth regardless of number of tasks. |
| Timeline width (date span) | Timeline virtualization supports multidecade project spans. | Only the timeline cells required for the visible viewport and a surrounding buffer are rendered in the DOM; additional date ranges are rendered dynamically as the user scrolls. |
| Hierarchy depth | Deep parent-child hierarchies supported with load-on-demand. | Child rows are fetched and rendered only when a parent is expanded. |
| Large row and column datasets | Row and column virtualization supported together. | Rendering limited to visible cells within the viewport in both axes. |
| Multiproject view | Multiple top-level parent tasks representing projects supported. | Each project group and its children are managed independently within the flat data structure. |
| Concurrent instances | Multiple Gantt instances supported on the same page. | Each instance maintains its own bounded DOM footprint and rendering lifecycle. |
| Frequent task updates | Targeted update APIs supported. | Only the affected task rows and their dependent predecessor lines re-render. |
| Large resource pool | Resource assignment supported with large resource collections. | Resource data is maintained in memory; assignment dialog renders only on demand. |
| Export of large datasets | Server-side Excel and PDF export supported. | Export generation occurs outside the browser runtime; avoids browser memory constraints. |
4
Security and compliance
Organizations must understand how security responsibilities are shared between the application and the UI layer before deployment. This section evaluates security architecture, data protection considerations, and compliance assurance practices to help determine whether the Syncfusion React Gantt Chart aligns with enterprise security and governance requirements.
Security architecture and responsibilities
Security boundaries, risk ownership, and governance considerations shape how the Gantt Chart fits within an enterprise security architecture.
Security responsibility matrix
The matrix below outlines the security boundary between the Gantt Chart and the host application, identifying which controls are provided by the Gantt Chart and which must be implemented by the application.
| Security concern | Component behavior | Application responsibility |
|---|---|---|
| Cross Site Scripting (XSS) | Renders data provided by the application; supports template sanitization when enabled. | Sanitize user input on the server, prevent unsafe HTML in templates, and enforce strict validation. |
| Authentication | Does not handle user identity, credentials, or session management. | Integrate an identity provider and perform session or token lifecycle management in the application. |
| Authorization | Does not have built in permission enforcement; visibility & edit behavior rely on configuration. | Enforce RBAC or ABAC rules, restrict visibility, and block unauthorized edits, link creation, or status changes. |
| Sensitive data handling | Displays data as provided with no masking or redaction. | Apply backend masking and remove confidential or regulated fields before sending to a client. |
| Data export | Exports only client provided data. | Enforce export permissions, mask or omit regulated content, and apply governance policies. |
| Audit logging | Emits events for task edits, progress changes, dependency updates, drag or resizing actions, and timeline navigation. | Capture emitted events and forward them to logging or SIEM systems with appropriate context. |
| Transport security | Uses the application's existing HTTP stack and does not initiate independent network calls. | Configure TLS, enforce HTTPS, set certificate policies, and secure back-end endpoints for Gantt Chart CRUD operations. |
| Content Security Policies (CSPs) | Operates within CSP-restricted applications and does not require unsafe-inline or unsafe-eval. | Configure strict CSP headers; validate that templates and scripts comply with policy. |
| Dependency security | Delivers as a versioned npm package with no runtime CDN dependencies. | Maintain strict dependency update practices and continuously track security vulnerabilities using standard security tooling. |
| Input validation & data integrity | Accepts values without enforcing business rules. | Validate date ranges, prevent circular dependencies, and reject malformed or malicious payloads. |
| Multitenancy & data isolation | Does not enforce tenant boundaries. | Apply tenant-level filtering and row-level security; validate tenant context for every request. |
| Caching & client-side storage | Stores data only in memory; no persistent storage by default. | Avoid storing sensitive data in local storage or session storage; control caching headers. |
Security architecture overview
The Gantt Chart functions as a client-side presentation and interaction layer. All tasks originate from the application API or state layer, and user interactions are emitted as structured events for application processing. It does not communicate directly with databases, maintain server-side state, or bypass existing security controls.
OWASP security responsibility context
The Gantt Chart addresses OWASP security risk areas relevant to a client-side project planning and visualization solution. As a browser-based UI layer, it renders application-provided data and emits interaction events, but it does not implement server-side security controls or enforce security policies. The table below maps applicable OWASP risk categories to the Gantt Chart and identifies where mitigation responsibilities reside.
| OWASP risk area | How it relates to the Gantt Chart | Responsibility |
|---|---|---|
| A01: Broken Access Control | The Gantt Chart displays data exactly as delivered by the application. It does not enforce permissions over which tasks a user can see or modify. | Access control enforcement must occur in the back end and application logic. |
| A03: Software Supply Chain Failures | The Gantt Chart component relies on distributed library artifacts, making it susceptible to supply chain risks if provenance and integrity are not ensured. | The organization should adopt secure sourcing policies, enable dependency monitoring, and enforce controlled build environments. |
| A04: Cryptographic Failures | Any data shown in the Gantt Chart flows between the browser and the backend API. The component does not apply encryption itself. | TLS configuration, certificate management, and encryption policies must be implemented at the infrastructure and backend layers. |
| A05: Injection | User-supplied data rendered in the Gantt Chart may contain malicious content, and if not properly sanitized, it can lead to XSS vulnerabilities. | Applications must validate, escape, and sanitize all task or resource data before sending it to the client. Template content must be generated safely. |
| A07: Authentication Failures | The component does not manage authentication, session state, tokens, or user identity. | Authentication flows must be implemented and secured by the application and identity provider. |
| A08: Software or Data Integrity Failures | Delivered via npm; its integrity depends on package authenticity, registry security, and controlled build pipelines. | Use pinned versions, lock files, checksum validation, and internal mirrors to ensure supply chain integrity. |
| A09: Security Logging and Alerting Failures | The Gantt Chart triggers client-side events reflecting user interactions and data changes, but it does not record or store these events on its own. | Applications should capture relevant events, associate them with user identity, and integrate with centralized logging, monitoring, or SIEM systems. |
Application and data security
The security posture of a Gantt Chart implementation is determined by how application data, user access, deployment environments, and export workflows are managed.
Data flow and network behavior
All Gantt Chart data traffic follows the application’s existing endpoints, headers, gateways, proxies, WAF rules, and monitoring controls. The component does not introduce an independent networking layer and operates strictly as a client-side UI layer.
Network and security controls remain owned and enforced by the application and its infrastructure, including API routing, authentication headers and credentials, server-side validation and authorization, API gateways, reverse proxies, WAFs, and traffic inspection controls.
Authentication and authorization integration
Authentication verifies user identity, while authorization determines permitted actions. The Gantt Chart integrates with the application’s existing security and access-control mechanisms, but authorization must be enforced by the back end for every task, hierarchy, dependency, resource, and export operation.
| Security requirement | Gantt Chart capability | Security enforcement layer |
|---|---|---|
| Task visibility control | Only tasks, milestones, and dependencies supplied by the application are rendered. | Application layer: Task data is filtered before binding based on the user role. |
| Row-level task and hierarchy visibility | Only authorized tasks, along with their parent-child hierarchies and milestones, are rendered per user or project. | Back end: Access controlled and role or project based queries restrict returned tasks and related hierarchies. Application layer: Only the task data and hierarchies supplied by the API are rendered and bound. |
| Edit Permissions | Editing actions like add, edit, delete, drag, and resize can be enabled or disabled per task or column. | Application layer: Edit settings are applied based on permission evaluation before rendering. |
| Role-based edit permissions | All edit actions are configurable by user role or claim. | Application layer: Role- or claim-based permission is evaluated at render time. |
| Read-only Gantt Chart mode | All editing and interaction features can be globally disabled. | Application layer: Read only mode is enabled via configuration options based on role or session context. |
| Dependency editing rules | Dependency creation or modification events can be intercepted and validated. | Application layer: Authorization or business rules are enforced before completing changes. |
| Sensitive data masking | Task fields can be masked or formatted as needed. | Back end or application layer: Masking is applied before binding; back-end masking is preferred for regulated data. |
| Resource access control | Resources are rendered only when bound to authorized tasks. | Back end: Resource access is validated per task or project. |
| Authenticated API communication | Data operations use authenticated HTTP requests. | Application layer: Auth tokens are attached via DataManager. Back end: Tokens are validated per request. |
| Secure event trust boundary | All change events are treated as untrusted input. | Back end: Authorization is revalidated regardless of client-side configuration. |
| Audit and traceability support | Gantt Chart emits deterministic change events for user actions. | Application layer: Events are forwarded to audit logs or SIEM systems. |
| Edit and change audit capture | Task, dependency, and scheduling changes emit events. | Application layer: The layer listens to Gantt Chart change events and forwards audit records. |
Deployment security characteristics
The Gantt Chart has fixed deployment-time security characteristics that are inherent to its architecture. It operates as a client-side, self-hosted component with no Syncfusion-hosted runtime services, runtime CDN dependencies, telemetry, external scripts, unsafe-eval requirement, or browser storage by default.
| Deployment characteristic | What it means |
|---|---|
| No external runtime connections by default | The component does not make outbound network calls to Syncfusion services or third party endpoints. All interactions occur only through the hosting application. |
| CDN free self hosted deployment | All required JavaScript, CSS, and asset files are bundled in the npm package. No CDN or remote asset dependency exists at runtime. |
| Compatible with air gapped or closed networks | The Gantt Chart operates fully offline in isolated or regulated environments. It requires no internet access for rendering or license validation. |
| Internal registry installation | The npm packages can be installed entirely from internal repositories such as Nexus or Artifactory without accessing the public npm registry. |
| CSP unsafe-inline not required | No inline styles are injected at runtime. All styling uses external stylesheets, supporting strict CSP enforcement. |
| CSP unsafe-eval not required | The component does not use eval, function constructors, or similar dynamic code execution, which allows for secure CSP configurations without unsafe-eval. |
| No telemetry or analytics calls (component behavior) | The Gantt Chart does not send usage data, analytics, diagnostics, or error telemetry to Syncfusion or external systems. |
| No embedded third party scripts | The component does not include or load scripts from external domains. All logic is shipped within the package. |
| Deterministic build only behavior | The component behaves consistently based on its shipped code and does not change due to environment variables or remote configurations. |
| No browser storage by default | The Gantt Chart does not write data to localStorage, sessionStorage, or IndexedDB, preventing unintended persistence of sensitive information. |
| No cookie or token handling by the component | The component does not read, write, or manipulate cookies, tokens, or authentication artifacts. |
| Pure client side rendering model | The Gantt Chart runs entirely in the browser and does not rely on server side rendering or server-executed templates that may introduce injection risk. |
Export security
Export is enabled and invoked by the application. The output contains only data supplied by the application, so permissions, masking, scope, and logging must be applied before export.
| Export security concern | How it is addressed | Enforcement location |
|---|---|---|
| Export initiation and authorization | The Gantt Chart does not initiate exports on its own. Export functionality is available only when explicitly enabled and invoked by the host application. | Application layer |
| Who can trigger an export | Export actions are explicitly controlled by the hosting application. Export functionality can be enabled, restricted, or disabled based on user roles, permissions, or application logic. | Application layer |
| External data transmission during export | Exported data is not transmitted to Syncfusion hosted or third party services. All export data remains within the application boundary. | Client runtime or application network layer |
| Scope of exported data | Export outputs include only the task, dependency, and resource data explicitly supplied to the Gantt Chart by the application. No hidden or additional data is included. | Application layer |
| What data appears in the export | The export output reflects the data provided to the Gantt Chart by the application. If the application supplies masked or transformed values, those values appear in the export. | Application layer |
| Export audit logging | Export actions can be intercepted by the application and routed to the application's logging or audit pipeline. | Application layer to logging system |
| Offline or restricted environments | Export operations can function in on premises or restricted environments without requiring internet access or external endpoints. | Deployment environment |
Compliance and security assurance
Organizational controls, security practices, and supporting documentation provide evidence for assessing compliance, risk management, and product assurance.
Compliance certifications
These certifications and standards describe Syncfusion organizational practices and accessibility commitments. The Gantt Chart benefits from these organizational controls and supporting documentation, but they do not replace the compliance obligations of the consuming application.
| Certification or standard | Syncfusion coverage | Procurement reference |
|---|---|---|
| SOC 2® Type 2 | Syncfusion maintains independently audited controls, covering security, availability, and operational practices at the organizational level. Support the secure development and delivery of UI components. | SOC 2® Type 2 overview |
| GDPR | Syncfusion follows GDPR aligned data handling practices. The Gantt Chart is a client side UI component that processes application supplied data without controlling its purposes or retention. | GDPR overview |
| WCAG 2.1 AA (accessibility) | Syncfusion UI components, including the Gantt Chart, are designed and tested to support WCAG 2.1 AA accessibility guidelines, and documentation is available across component suites. | Accessibility standards |
| ISO 27001 | Syncfusion maintains an information security management framework aligned with ISO 27001 principles. Certification status is available through Syncfusion enterprise engagement. | Contact sales team for certification details. |
| Section 508 | WCAG 2.2 AA alignment provides the foundation for Section 508 conformance, and formal documentation is available via enterprise procurement. | Section 508 documentation |
Vulnerability management
Syncfusion maintains a defined vulnerability management lifecycle to monitor, address, and communicate security issues affecting the Gantt Chart component. Identified issues are addressed through regular product releases, and reported concerns are handled via an established responsible disclosure program.
| Vulnerability management aspect | Syncfusion coverage | Where to verify |
|---|---|---|
| Responsible disclosure policy | Syncfusion offers a publicly documented responsible disclosure process that provides a dedicated reporting channel for external security researchers. | Responsible disclosure |
| Security patch delivery | Security fixes for the Gantt Chart component are included in regular product releases and distributed through standard npm package channels. | Release notes |
| Security fix documentation | Release notes document resolved issues, including security-related fixes and the versions in which they were addressed. | Release history |
| Enterprise security escalation | Security issues can be reported through Syncfusion support; enterprise customers receive priority escalation per their support agreement. | Support SLA |
| Dependency vulnerability monitoring | Third party dependencies used by the Gantt Chart component are routinely monitored and updated as part of ongoing product maintenance. | Release notes |
Explore our blog on achieving regulatory compliance to understand how Syncfusion components maintain compliance standards.
Security assurance statements
The following assurance statements describe documented runtime behaviors and security characteristics of the Gantt Chart, along with methods that can be used to verify them during security reviews and deployment assessments.
| Assurance statement | Verification method |
|---|---|
| The Gantt Chart component does not initiate outbound network calls to Syncfusion or third party services during normal runtime operation. | Open Browser DevTools and check the Network tab while interacting with the Gantt Chart. Ensure that no unexpected external requests appear. |
| No inline styles are injected into the DOM at runtime by the component. | Inspect the Elements panel in Browser DevTools and review the CSP violation log to confirm that no inline styles are being applied. |
| The rendering pipeline does not use eval, function constructors, or other dynamic code execution mechanisms. | Review the Console and CSP reports in DevTools to confirm that no unsafe-eval violations are logged. |
| User supplied data rendered in the Gantt Chart is processed in a way that prevents script execution, mitigating XSS risks. | Test with harmless XSS payloads and confirm that the Gantt Chart displays them safely without executing scripts. |
| The component does not access or manage credentials, authentication tokens, cookies, or browser session storage. | Review the Storage, Cookies, Local Storage, and Session panels in DevTools to confirm that no entries are created or modified by the Gantt Chart. |
| Syncfusion compliance documentation on SOC 2® Type 2, GDPR, and related compliance is available to enterprise customers. | Request documentation through Syncfusion enterprise procurement channels. |
| WCAG 2.1 AA accessibility conformance documentation is available for the React Gantt Chart and related component sets. | Accessibility documentation |
| Security patches and dependency updates affecting the Gantt Chart component are delivered through standard release cycles. | Release history and Release notes |
| Emitted events contain only component-level state information and do not expose internal browser metadata or sensitive context. | Inspect Gantt Chart event payloads in the console to confirm only expected fields are included. |
5
Interactive live demos
Use the interactive live demos to assess the component in representative usage scenarios. Explore key capabilities, interactions, configuration options, and runtime behavior to validate functional fit and user experience against application requirements.
Try our Live Demo
6
Evaluation checklist
Print or copy this checklist into the evaluation record. Each item maps to a capability, condition, responsibility, or verification method documented above.
01. Functional fit
- Required task hierarchy, predecessor types, lag, milestones, baselines, critical path, resources, and project views are validated.
- Inline, dialog, taskbar drag, resize, splitter, toolbar, tooltip, undo, redo, and export workflows meet the intended process.
- Localization, RTL, keyboard navigation, accessibility, and responsive requirements are verified.
02. Architecture and delivery
- React version, target browsers, and SSR strategy align with the application roadmap.
- Production build, package format, TypeScript, CSS, internal registry, and CI/CD pipeline have passed.
- Micro-frontend singleton ownership and multi-Gantt instance isolation are validated.
- State management and design-system integration remain application-owned and maintainable.
03. Data, API, and extensibility
- The selected adaptor works with the real API, hierarchy, task, dependency, and CRUD contract.
- Database and ORM access occurs through secured back-end endpoints.
- JWT or OAuth headers, token refresh, mTLS, and 401/403 handling are validated.
- The most complex required taskbar, timeline, tooltip, column, or toolbar customization is implemented.
- Programmatic events and methods cover scheduling, validation, auditing, export, and cross-component workflows.
04. Performance and scalability
- Row virtualization, timeline virtualization, and load-on-demand are configured for the target workload.
- Initial render, scrolling, hierarchy expansion, editing, dependency changes, real-time task updates, and export meet agreed targets.
- Long-running session memory and DOM behavior are profiled with DevTools.
- Any required batching or throttling for high-frequency updates is implemented outside the Gantt Chart.
05. Security and compliance
- Authentication, authorization, tenant isolation, validation, masking, circular-dependency prevention, and audit logging are enforced by the back end.
- Outbound requests, storage, CSP, unsafe-eval, package installation, and offline behavior are independently verified.
- Export permissions, fields, masking, scope, and audit requirements are enforced.
- Current SOC 2, GDPR, accessibility, Section 508, ISO 27001 status, vulnerability, and support evidence has been reviewed.
06. Final decision
- No unsupported runtime or required native-mobile use case remains unresolved.
- Every source condition and limitation has an owner, mitigation, or accepted exception.
- Performance evaluation results are documented and compared with application requirements.
- The result is recorded as pass, conditional pass, or fail for every mandatory evaluation area.
- Stakeholders approve the remaining implementation, security, procurement, and maintenance responsibilities.
7
Frequently asked questions
Review common questions that influence architecture fit, performance validation, security approval, and long-term adoption decisions.
Does the React Gantt Chart work in a mixed Next.js Pages Router and App Router application?
Yes. The React Gantt Chart supports both the Next.js Pages Router and App Router. During migrations where both routing models coexist in the same application, the Gantt Chart can be used in either environment. The documented client-component boundary requirement applies only to App Router pages.
How does the React Gantt Chart prevent conflicting versions across micro-frontends?
The React Gantt Chart can be shared across micro-frontends by declaring Syncfusion packages as shared singletons in the Module Federation shell configuration. This helps ensure that a single version is loaded across consuming applications. Version management is handled at the shell level through shared dependency and CSS policies rather than individually by each application module.
Can the React Gantt Chart support environments where full project datasets cannot be loaded into the browser?
Yes. The React Gantt Chart supports server-executed data operations, including initial loading, CRUD actions, filtering, sorting, and load-on-demand child fetching. The browser can receive only the records required for the current view, allowing applications to work with large project datasets without transferring the entire project hierarchy to the client.
Can the React Gantt Chart maintain performance in a 15-year project with thousands of tasks during navigation and scrolling?
Yes. The React Gantt Chart supports row virtualization for large task datasets and timeline virtualization for wide date ranges. These capabilities can be used together, allowing long-duration projects with thousands of tasks to render efficiently while keeping DOM usage and scrolling performance predictable.
Does the React Gantt Chart support architectures where authentication and authorization remain in the application layer?
Yes. The React Gantt Chart does not manage authentication, authorization, user identity, or permissions. Security controls such as task visibility, edit rights, token management, and audit logging remain the responsibility of the application and back-end services.
Can users adjust tasks directly on the React Gantt Chart timeline?
Yes. The React Gantt Chart allows users to drag, resize, and edit taskbars directly on the timeline. Dependency and editing events can also be intercepted, allowing applications to apply validation, authorization, or business rules before changes are committed.
Does the React Gantt Chart support critical path analysis and resource planning?
Yes. The React Gantt Chart supports critical path analysis, resource assignment, and resource-based views for project planning, scheduling, and workload management.
Does the React Gantt Chart send project data to Syncfusion or other services?
No. The React Gantt Chart does not make outbound runtime calls to Syncfusion or third-party services as part of its documented deployment model. Data communication occurs only through application-defined endpoints and services.
What happens when exporting very large project datasets, such as 5,000+ tasks, from the React Gantt Chart to Excel or PDF?
The React Gantt Chart provides built-in Excel and PDF export capabilities that run entirely in the browser. For very large datasets, export generation can take longer and may increase browser memory usage because the complete export is processed in memory.
Can the React Gantt Chart run in air-gapped or offline environments?
Yes. The React Gantt Chart can operate in air-gapped or offline environments because it does not require internet access for rendering. Required assets and application APIs must be available within the environment, while data availability and synchronization remain application responsibilities.
Do React Gantt Chart major version upgrades introduce breaking changes?
Yes. React Gantt Chart breaking changes are introduced only in major releases and may include updates to APIs, configuration settings, or styling behavior. Syncfusion provides migration guidance for major releases to help applications validate and adopt changes before moving to production.
8
Resources
Reference these source links for technical validation, implementation guidance, troubleshooting, design evaluation, and procurement review.
- React Gantt Chart documentation- Start with installation and basic configuration.
- Knowledge base articles- Review task-specific solutions and troubleshooting guidance.
- Tutorial videos- Follow feature walkthroughs in video format.
- Feature walkthrough video- See guided product overviews and demonstrations.
- Live interactive demo- Explore the Gantt Chart in a browser.
- Feature web story- Review a brief visual feature summary.
- Figma UI kits- Check available design assets.







