React Diagram - Evaluation Guide
Evaluate the Syncfusion React Diagram for Enterprise Adoption
The Syncfusion React Diagram support workflow automation, architecture modeling, organizational structures, network visualization, BPMN, UML, flowcharts, mind maps, and visual application design. As application complexity grows, they must deliver high performance, secure data interactions, flexible integration, and a consistent user experience. This guide organizes the supporting technical evidence into a practical evaluation sequence while preserving compatibility details, API information, performance limits, security responsibilities, tables, and references.
Use the visible framework first, then expand only the technical topics needed for the diagram under review.
Quick evaluation framework
Evaluate these areas in the following order so that any compatibility issues or security constraints are identified early, before investing time in advanced customization and testing.
| Step | Evaluate | Questions to answer | Evidence to collect |
|---|---|---|---|
| 1. | Application fit | Which diagram types, editing workflows, layouts, persistence model, and target devices are required? | Representative diagrams, user roles, interaction map, and data model. |
| 2. | Runtime and delivery | Does it fit React, Next.js client boundaries, browsers, build tools, package formats, and micro-frontends? | Production build, dependency graph, browser matrix, and shell configuration. |
| 3. | Data and API integration | How are nodes, connectors, layouts, authentication, serialization, and persistence connected to application services? | Production-shaped API contract, authenticated load/save test, and event map. |
| 4. | Performance and scale | Can virtualization, incremental updates, collaboration, and viewport interactions handle the largest expected diagram? | Target-device profiling, DOM inspection, long-session test, and collaboration load test. |
| 5. | Security and governance | Where are sanitization, permissions, tenant isolation, audit logging, CSP, export policy, and compliance evidence enforced? | Threat model, authorization tests, CSP report, export test, and procurement artifacts. |
| 6. | Final decision | Do all mandatory criteria pass, or have accepted conditions with owners and deadlines? | Completed checklist, POC results, risks, mitigations, and ownership. |
AI integration and responsibility
The Diagram can host application-level AI experiences such as text-to-flowchart, text-to-mind map, and text-to-UML sequence diagram. These capabilities are wired in at the application layer and routed through the application’s own back end or model endpoints — the Diagram does not include an AI runtime or call an external service.
AI responsibility boundary: The application manages AI services, prompts, data, validation, persistence, and governance, with AI-generated content following the Diagram’s data-flow boundaries.
1
Architecture compatibility
Evaluate how well the Diagram integrates with the application’s existing architecture, including rendering patterns, build processes, styling approach, browser support, and testing ecosystem. This helps ensure the component can be adopted without requiring major architectural changes.
Framework and runtime compatibility
Verify that the Diagram supports the application’s framework, React version, runtime environment, and rendering model. This ensures the component functions correctly within the existing technology stack and deployment environment.
Framework and environment support
Confirm that the target deployment environment is supported and note any required setup conditions. The Diagram integrates consistently across supported React web environments.
Use the published system requirements as the versioned compatibility reference.
| Deployment Environment | Coverage |
|---|---|
| React 18/19 SPA | Supported and works with standard configuration. |
| Next.js App Router | Supported. It requires client component usage with documented guidance. |
| Next.js Pages Router | Fully supported. It’s stable on all Pages Router versions. |
| Vite SPA | Fully supported. It integrates as a standard package dependency. |
| Remix | Fully supported. Client side hydration behavior is documented and reliable. |
| Gatsby SSG | Fully supported. It has static generation and hydrates correctly at runtime. |
| Electron | Supported. It runs inside Electron's renderer process as a standard React component. |
| Micro front-end (Module Federation) | Supported. Declare as a shared singleton at the shell level; one version loads for all teams. |
| Micro front-end (single-SPA) | Supported. It runs as a standard, client-rendered React component inside single-SPA. |
| Preact | Fully supported. The Diagram works via Preact’s React‑compact compatibility layer. |
React version compatibility
Match the application’s React version to the minimum Syncfusion version before installation or upgrade.
Keep related @syncfusion packages on compatible versions, and review the release history when planning future React major updates. The release history documents compatibility across previous React major versions, helping teams plan upgrades with confidence.
| React Version | Syncfusion Minimum Version | Approximate Release Year | Coverage |
|---|---|---|---|
| React 16 | Syncfusion v16 | 2018 | Fully supported and documented in the current release. |
| React 17 | Syncfusion v18 | 2020 | Fully supported and documented in the current release. |
| React 18 | Syncfusion v20 | 2022 | Fully supported and documented in the current release. |
| React 19 | Syncfusion v29 | 2025 | Confirmed compatible in the latest release notes. |
| React Strict Mode | No minimum version constraint. | — | Fully compatible. There are no double-invoke or duplicate state mutation issues in development Strict Mode. |
| Organization-pinned React version | N/A | — | No peer dependency conflicts. The Diagram consumes the host application's React version. |
| Future React major version planning | Reviewable in release history. | — | Historical adoption pace across React 17, 18, and 19 provides evidence-based upgrade planning. |
Browser and runtime support
Check the published browser compatibility matrix for supported browsers, accessibility, high-contrast rendering, and legacy browser limitations. Internet Explorer is end-of-life and requires the documented ES6 Promise polyfill.
| Browser/Runtime | Coverage |
|---|---|
| Chrome (latest) | Fully supported |
| Firefox (latest) | Fully supported |
| Safari (latest) | Fully supported |
| Microsoft Edge (latest) | Fully supported |
| Opera (latest) | Fully supported |
| Internet Explorer 11+ (EOL — June 2022) | Supported when the ES6 Promise polyfill is added, as noted in the documentation. |
Build, package, and module compatibility
Confirm that the Diagram aligns with the organization’s existing build processes, package management strategy, and modular delivery architecture without requiring proprietary tooling.
Build compatibility
Run Diagram in the organization’s actual build pipeline. It installs as a standard npm/ESM package, works with existing build setups without proprietary build plugins, and typically requires no additional build configuration.
Only imported feature modules should enter the production bundle, although the final output depends on the application’s import patterns and bundler configuration.
| Environment/Toolchain | Support |
|---|---|
| Webpack | Fully supported. It works as a standard npm/ESM React package with no custom plugins required. |
| Vite | Fully supported. It’s ESM-compatible and integrates without configuration. |
| Turbopack | Supported via ESM export. Core rendering and data binding is validated by Syncfusion under Turbopack’ s production pipeline. No Turbopack-specific plugin is required. Teams should verify their own CSS strategy and SSR/Suspense configuration. |
| Nx / Turborepo (Monorepo) | Fully supported. Standard npm dependency declaration; no custom executors, generators, or monorepo-specific configuration is required. |
TypeScript Strict Mode ("strict": true) |
Fully compatible. All public APIs, props, and event signatures are fully typed; no @ts-ignore suppressions required for standard usage. |
| Next.js (App & Pages Router) | Supported. Client-component usage where needed. |
| Create React App (legacy — deprecated) | Supported for existing projects. For new projects or migrations, Vite is the recommended replacement. The Diagram's Vite integration guide applies directly with no diagram-level changes required. |
Package distribution and module Support
Select the package format that matches the application and test toolchain. ESM is the primary format, while CommonJS and UMD support legacy loading paths.
Inspect the distributed package structure on the npm package page when validating module support, package contents, or internal registry requirements.
| Module Format | Support | Notes |
|---|---|---|
| ESM | Fully supported | Ships as the primary format (dist/es6). Used by default in Vite, Next.js, and Webpack 5 builds. |
| CJS (CommonJS) | Supported | Compatible with legacy Node toolchains, Jest, and CommonJS-based module loaders such as RequireJS and SystemJS. |
| UMD | Fully supported | Available as dist/[package-name].umd.min.js. Loadable in browsers via script tag, AMD, and CommonJS loaders. |
Micro-frontend and Module Federation compatibility
Treat micro-frontends as a shared-dependency decision. The Diagram supports Webpack Module Federation and Single-SPA. Configure Syncfusion packages as shell-level singletons to avoid duplicate bundles and version conflicts.
| Micro Front-End Scenario | Coverage |
|---|---|
| Multiple Diagrams on the same page | Each instance maintains independent state with no cross-instance interference. |
| Module Federation shell (Webpack) | Shared dependency configuration is documented. It prevents bundle duplication and version conflicts across micro apps. |
| Vite Module Federation | Supported via @originjs/vite-plugin-federation — shared singleton configuration applies identically to Webpack MF. |
| Lazy-loaded route (React.lazy) | Compatible. No special configuration is required. |
Application architecture integration
Evaluate how the Diagram fits within existing application architecture, established data-flow patterns, and organizational design-system standards without requiring architectural refactoring.
Theming and design system integration
Verify that the built-in themes and CSS customizations (including CSS variables, SCSS, design tokens, and common styling approaches) can match the required design system without modifying component source.
- 22 built-in themes including Fluent 2, Material 3, Bootstrap 5.3, and Tailwind 3.
- Design token-ready via CSS variables; themes stay current across version upgrades without source patching.
| CSS Strategy | Coverage |
|---|---|
| CSS custom properties / design tokens | Supported. The Diagram exposes CSS variables for design token overrides. |
| Sass / SCSS variable override | Supported. Themes are built in SCSS and customizable through Theme Studio. |
| CSS Modules | Supported. Preventing global style conflicts. |
| Runtime multitenant theme switching | Partially supported, CSS file or class swaps work for basic scenarios; full brand customization requires Theme Studio. |
| Dark mode | There are built-in dark variants for all themes with no custom CSS required. |
| Brand / design system alignment | Supported. CSS variables and SCSS tokens cover typography, color, and spacing alignment. |
CI/CD and testing compatibility
Confirm that the Diagram can be built, tested, and deployed through existing engineering workflows without requiring specialized tooling or infrastructure.
| Testing Tool | Compatibility | Notes |
|---|---|---|
| Jest | Fully supported | Blog reference |
| Vitest | Fully supported | Works with jsdom and happy-dom environments. |
| React Testing Library | Fully supported | Standard DOM queries work. No vendor-specific selectors needed. |
| Cypress | Fully supported | E2E tests run against Diagram interactions without custom configuration. |
| Playwright | Fully supported | Diagram elements are accessible via standard locators. |
| Storybook | Supported | The Diagram renders correctly for visual regression testing. |
Try live demo and navigate to the Testing tab to explore testing approaches and validate implementations using code examples and test cases.
2
Integration and extensibility
Connect the Diagram to existing data sources, authentication systems, and design systems. Assess extensibility through APIs, events, templates, and customization points while verifying compatibility with existing backend integrations, authorization requirements, and multi-instance deployments.
Data and back-end integration
Verify how the Diagram integrates with application services and authenticated backend APIs that use the organization’s existing databases and ORMs.
Data source integration
Choose the adaptor according to the API contract. DataManager retrieves JSON node and connector data, maps it into the Diagram model, and handles request/response processing without manual front-end mapping.
| Adaptor | When to use it | Enterprise benefit |
|---|---|---|
| URL adaptor | Back end exposes standard REST APIs. | Works with any back-end technology; compatible with microservice and cloud-native architectures. |
| ODataV4 adaptor | Back end provides services compliant with OData v4. | Standardized query protocol, which reduces the need for a custom API surface and improves consistency across services. |
| Custom adaptor | API follows a non-standard or proprietary format. | Full control over request and response shaping; allows extending any built-in adaptor without building from scratch. |
Use a custom adaptor when field names, response envelopes, authentication headers, or persistence payloads do not match the built-in REST or OData patterns.
Try live demo and navigate to the Integration tab, then select the Adaptors chip to explore available data adaptors and their configuration patterns.
Back-end framework coverage
Choose the adaptor based on the endpoint protocol and response shape rather than the server language. The framework-to-adaptor mapping below helps identify the recommended integration approach for common back-end frameworks.
| Back end | Possible adaptors | Reason |
|---|---|---|
| Express (Node.js REST APIs) | URL adaptor, OData adaptor, Custom binding | Supports REST-based JSON responses for nodes and connectors, while adaptors enable mapping and integration across varying endpoint types. |
| Django REST framework | URL adaptor, Custom binding | Django REST exposes standard REST endpoints, allowing direct integration via URL adaptor, while a custom binding handles response formatting differences. |
| FastAPI | URL adaptor, Custom binding | FastAPI exposes standard REST endpoints; custom binding handles non-default response formats and metadata mapping. |
| Flask and FlaskAPI | URL adaptor, Custom binding | REST-based by default; custom binding handles lightweight or non-standard API response structures. |
| Next.js API routes | URL adaptor, Custom binding | API routes behave as REST endpoints, so the URL adaptor applies directly. |
| OData services | OData adaptor, ODataV4 adaptor | These work directly when the API follows OData query and response conventions. |
Try live demo and navigate to the Integration tab, then select the Backends chip to explore Diagram integration with backend technologies.
Database integration
Diagram does not connect directly to a database. Nodes, connectors, metadata, and saved layouts must pass through an application-owned API. Integration guidance is available for supported back-end databases.
| Database | Possible adaptors |
|---|---|
| Microsoft SQL Server | URL adaptor, Custom adaptor |
| MySQL Server | URL adaptor, Custom adaptor |
| PostgreSQL Server | URL adaptor, Custom adaptor |
| SQLite Server | URL adaptor, Custom adaptor |
Try live demo and navigate to the Integration tab, then select the Databases chip chip to learn how to connect the Diagram to databases such as Microsoft SQL Server, MySQL Server and PostgreSQL Server through back-end APIs.
ORM compatibility
The Diagram has no direct ORM dependency. Any server-side ORM can be used when its API endpoint meets the adaptor request and response contract. Verified examples include Entity Framework Core, Hibernate and Java Persistence API, Django ORM, SQLAlchemy, Sequelize, Prisma, Laravel Eloquent, Dapper, custom ADO.NET, raw SQL, and stored procedures.
Authentication passthrough
For remote data, DataManager can carry application-supplied authentication headers. Loading and saving remain application-triggered operations rather than automatic Diagram requests.
| Auth pattern | Support |
|---|---|
| JWT bearer token | Configured on DataManager and attached to every request. |
| OAuth 2.0 (PKCE and client credentials) | A token is supplied by the application authentication layer and injected via the data manager headers. |
| Token refresh (silent and redirect) | Handled via the data manager request interceptor. |
| Mutual TLS (mTLS) | Configured at the HTTP transport layer, which is below the DataManager boundary. |
| Auth failure (401/403) | Surfaces via built-in failure event and the retry, redirect, and notification logic remain in the application layer. |
Refer to our documentation on custom headers and data-manager middleware logic.
API stability and extensibility
The Diagram supports customization through documented extension points, React templates, typed events, and methods, enabling flexible and maintainable implementations.
Versioning and API stability
Review semantic-versioning, API stability, deprecation, and migration policies to confirm that public properties, events, methods, and template APIs remain supported throughout the planned upgrade process.
| Change type | Policy |
|---|---|
| Breaking changes | Introduced only in major versions; not included in minor or patch releases. |
| New properties, events, and methods | Added in minor versions, backward compatible. |
| Deprecations | Deprecated members remain functional through the deprecation window and are flagged with TypeScript @deprecated annotations. |
| Major version upgrades | Accompanied by a migration guide with before and after examples scoped to the published breaking change list. |
Extensibility model
Use documented React templates and public APIs to customize Diagram visuals and interactions. These supported extension points help keep customizations compatible across version upgrades without source-level changes. React renders custom components within templates, while the application is responsible for sanitizing any untrusted HTML or text displayed in nodes, annotations, handles, tooltips, or other template content.
Node and rendering layer
Use node and annotation templates when the default visuals cannot represent the application’s domain model.
| Extension point | What it replaces | Common use |
|---|---|---|
| Node Template | Default node visual (entire node body). | Render HTML-based nodes by defining a node template and assigning it to the diagram, enabling fully customized structure and layout. |
| Annotation Template | Default label rendering. | Render HTML-based annotation content by defining a template and assigning it to the diagram, enabling rich layouts for both nodes and connectors. |
Interaction and editing layer
Use user-handle templates to provide application-specific editing actions without replacing the Diagram interaction model.
| Extension point | What it replaces | Common use |
|---|---|---|
| User Handle Template | Default user handle visuals (on selection). | Define custom HTML content for user handles, enabling flexible interaction elements using template-based rendering. |
| Fixed User Handle Template | Default fixed handle visuals (always visible). | Render fixed user handles using HTML templates by defining template content and assigning it in the diagram model for persistent interaction elements. |
Tooltip and contextual UI layer
Use tooltip templates for structured contextual information, and sanitize any user-provided content before rendering it.
| Extension point | What it replaces | Common use |
|---|---|---|
| Tooltip Template | Default tooltip content. | Customize tooltip content using HTML templates, enabling rich formatted text, images, and structured layouts for enhanced user experience. |
Try live demo and navigate to the Integration tab, then select the Extensibility chip to access related resources and examples.
Programmatic API — events and methods
Use the typed Event and Method to intercept interactions, manage elements, control the viewport, persist state, and trigger export. These versioned APIs provide comprehensive programmatic control over diagram behavior throughout the application lifecycle.
| Capability | Architectural implication |
|---|---|
| Pre-interaction interception | Any diagram interaction, such as node selection, dragging, resizing, or connection creation, can be intercepted by the application before execution. |
| Render lifecycle control | During component rendering, once the diagram is initialized, the lifecycle event can be intercepted, allowing you to customize diagram elements such as nodes and connectors before changes are finalized. |
| Programmatic element management | Nodes and connectors can be added, updated, removed, or batch-modified programmatically without user interaction. |
| Default object customization | Application-wide defaults can be applied programmatically so common styling and behavior rules are centralized instead of being duplicated for each object. |
| Selection state control | Node and connector selections are programmatically readable and settable, with support for single and multiple-selection and state persistence across interactions. |
| Grouping and ungrouping control | Elements can be grouped or ungrouped programmatically, and grouped lifecycle events can be intercepted. |
| Interaction capture | User interactions such as clicking, dragging, resizing, rotating, and node-level actions can be captured and used to trigger editing workflows or coordinated UI updates. |
| Zoom and pan control | Zooming and panning behavior are programmatically controllable, enabling guided navigation and viewport adjustment across large diagrams. |
| Multiformat export support | The Diagram supports exporting to multiple output formats, with control over region and multi-page options. |
| Serialization and persistence | The Diagram can be serialized into a JSON string format for storage in databases, files, or other systems, and later deserialized to recreate the Diagram exactly as it was previously configured. |
| Instance isolation | Each Diagram instance exposes an independent API surface with isolated state, ensuring multiple Diagrams operate without shared side effects. |
Multi-Diagram and micro front-end runtime behavior
The Diagram supports deployment in applications that use multiple Diagram instances or micro-frontend architectures, enabling flexible composition across modules and application boundaries.
| Runtime concern | How the Diagram behaves |
|---|---|
| State isolation among instances | Each Diagram instance maintains its own nodes, connectors, layout state, interaction state, and rendering lifecycle. Actions such as zooming, panning, selection, or editing in one Diagram do not affect any other instance. |
| Cross Diagram coordination | Coordination between Diagram instances is handled entirely through the application's state layer. Diagram exposes events and methods (for selection, updates, layout changes, etc.), while the application is responsible for synchronizing or sharing data across instances. |
| Micro front end module boundaries | Diagram functions as a self-contained React component. It can be added, updated, or removed from a module without affecting other modules in the shell. |
| Independent upgrade path | Each module can upgrade its Diagram version independently when the shell enforces a shared singleton. Version conflicts are resolved at the shell level, not at the module level. |
| Multi Diagram composition | Multiple Diagram instances can run simultaneously on the same page. Each Diagram renders, updates, and handles user interactions independently with no cross-instance event leakage or shared internal state. |
Review the micro-frontend architecture article for the referenced architecture pattern.
3
Performance and scalability
Evaluate performance optimization mechanisms, including viewport-based virtualization, efficient rendering, and incremental data or layout updates. Validate scalability across large numbers of nodes and connectors, complex diagrams, concurrent Diagram instances, real-time updates, interactive operations, custom node templates, and deployment constraints to ensure the Diagram meets workload requirements.
Rendering and viewport performance
Choose the viewport strategy before interpreting large-diagram claims.
Rendering performance modes
The Diagram provides multiple rendering performance strategies, including virtualization for large workspaces. These approaches optimize node and connector rendering, updates, and navigation interactions such as zooming and panning, helping reduce rendering overhead across different diagram sizes and interaction patterns.
| Feature | Typical scenario | What it prevents | Architectural outcome |
|---|---|---|---|
| Virtualization | Large diagrams with vertical and horizontal scrolling. | Rendering all diagram elements in the DOM at once. | DOM size stays constant regardless of diagram size; memory usage and interaction performance are unaffected by increased elements. |
| View level rendering (zoom and pan) | Navigation across large diagram workspaces. | Frequent re-rendering or modification of diagram elements during navigation. | Zooming and panning are handled at the viewport level, so navigation does not trigger re-rendering or updates to individual diagram objects. |
Mode combinations: Virtualization and view-level rendering can complement each other for large diagrams, while rendering strategies can be selected based on interaction and update requirements.
Performance benchmarking and validation
Benchmark data should be evaluated alongside the tested workload, environment, and measurement methodology to support informed performance assessments.
Benchmark scenario
The supplied source documents Diagram performance benchmark scenarios for initial diagram loading, node dragging, resizing, rotating, dynamic node and connector updates, deletion, and expand and collapse operations. Use these benchmarks to evaluate rendering efficiency, interaction responsiveness, and scalability planning.
| Benchmark scenario | What the benchmark measures | Architectural relevance |
|---|---|---|
| Initial diagram load | Time required to render the diagram and complete the initial viewport rendering. | Establishes baseline load performance for large-scale diagrams. |
| Drag 10 nodes | Time taken to update node positions and refresh affected connectors during drag operations. | Demonstrates responsiveness during diagram editing interactions. |
| Resize 10 nodes | Processing time required to resize nodes and update connected diagram elements. | Reflects performance during shape modifications and layout adjustments. |
| Rotate 10 nodes | Time taken to apply node rotations and refresh visual relationships. | Indicates responsiveness for interactive diagram manipulation. |
| Add 100 nodes and 100 connectors dynamically to the selected node as children | Processing time for runtime insertion of diagram elements and relationship updates. | Shows scalability when dynamically expanding large hierarchical structures. |
| Delete 101 nodes and 100 connectors at runtime | Time required to remove diagram elements and update associated relationships. | Demonstrates efficiency in handling large-scale runtime modifications. |
| Expand 5k nodes | Time required to expand a large hierarchical structure and render newly visible elements. | Demonstrates efficient rendering performance during expansion of large hierarchical diagrams. |
| Collapse 5k nodes | Time taken to collapse a large hierarchical structure and refresh the visible viewport. | Reflects performance when reducing visual complexity in large diagrams. |
Testing environment
- Component: Syncfusion React Diagram (2026 Volume 1, 33.1.44)
- Framework: React (production build)
- Browser: Google Chrome 122.x (Blink rendering engine)
- Operating system: Windows 11 (64‑bit)
- Hardware: AMD Ryzen 5 7530U processor, 16 GB RAM, AMD Radeon graphics
- Measurement methodology: Performance was measured on a 5,000-node, 5,000-connector diagram with annotations and virtualization enabled, covering loading, interactions, updates, and expand/collapse operations.
Disclaimer: Actual performance may vary based on hardware, browser version, viewport size, diagram complexity, node and connector count, enabled Diagram features, templates, and application configuration.
Benchmark results
The following results were recorded using a benchmark diagram containing 5,000 nodes and 5,000 connectors with annotations, with virtualization enabled. Timings cover the initial render and common diagram operations, including dragging, resizing, rotating, inserting and deleting nodes and connectors, and expand/collapse actions. Use these as a reference baseline and validate against your own diagram structure, element count, interaction patterns, and target hardware.
| Scenario | Virtualization (ms) |
|---|---|
| Initial load | ~2892 |
| Drag 10 nodes | ~360 |
| Resize 10 nodes | ~328 |
| Rotate 10 nodes | ~369 |
| Add 100 nodes and 100 connectors dynamically to the selected node as children | ~1233 |
| Delete 101 nodes and 100 connectors at runtime | ~1518 |
| Collapse 5K nodes | ~2510 |
| Expand 5K nodes | ~2665 |
Try live demo and navigate to the Performance tab to view and validate live performance metrics.
Real-time performance and scalability
Validate sustained element updates and scale dimensions beyond node count.
Real-time update performance
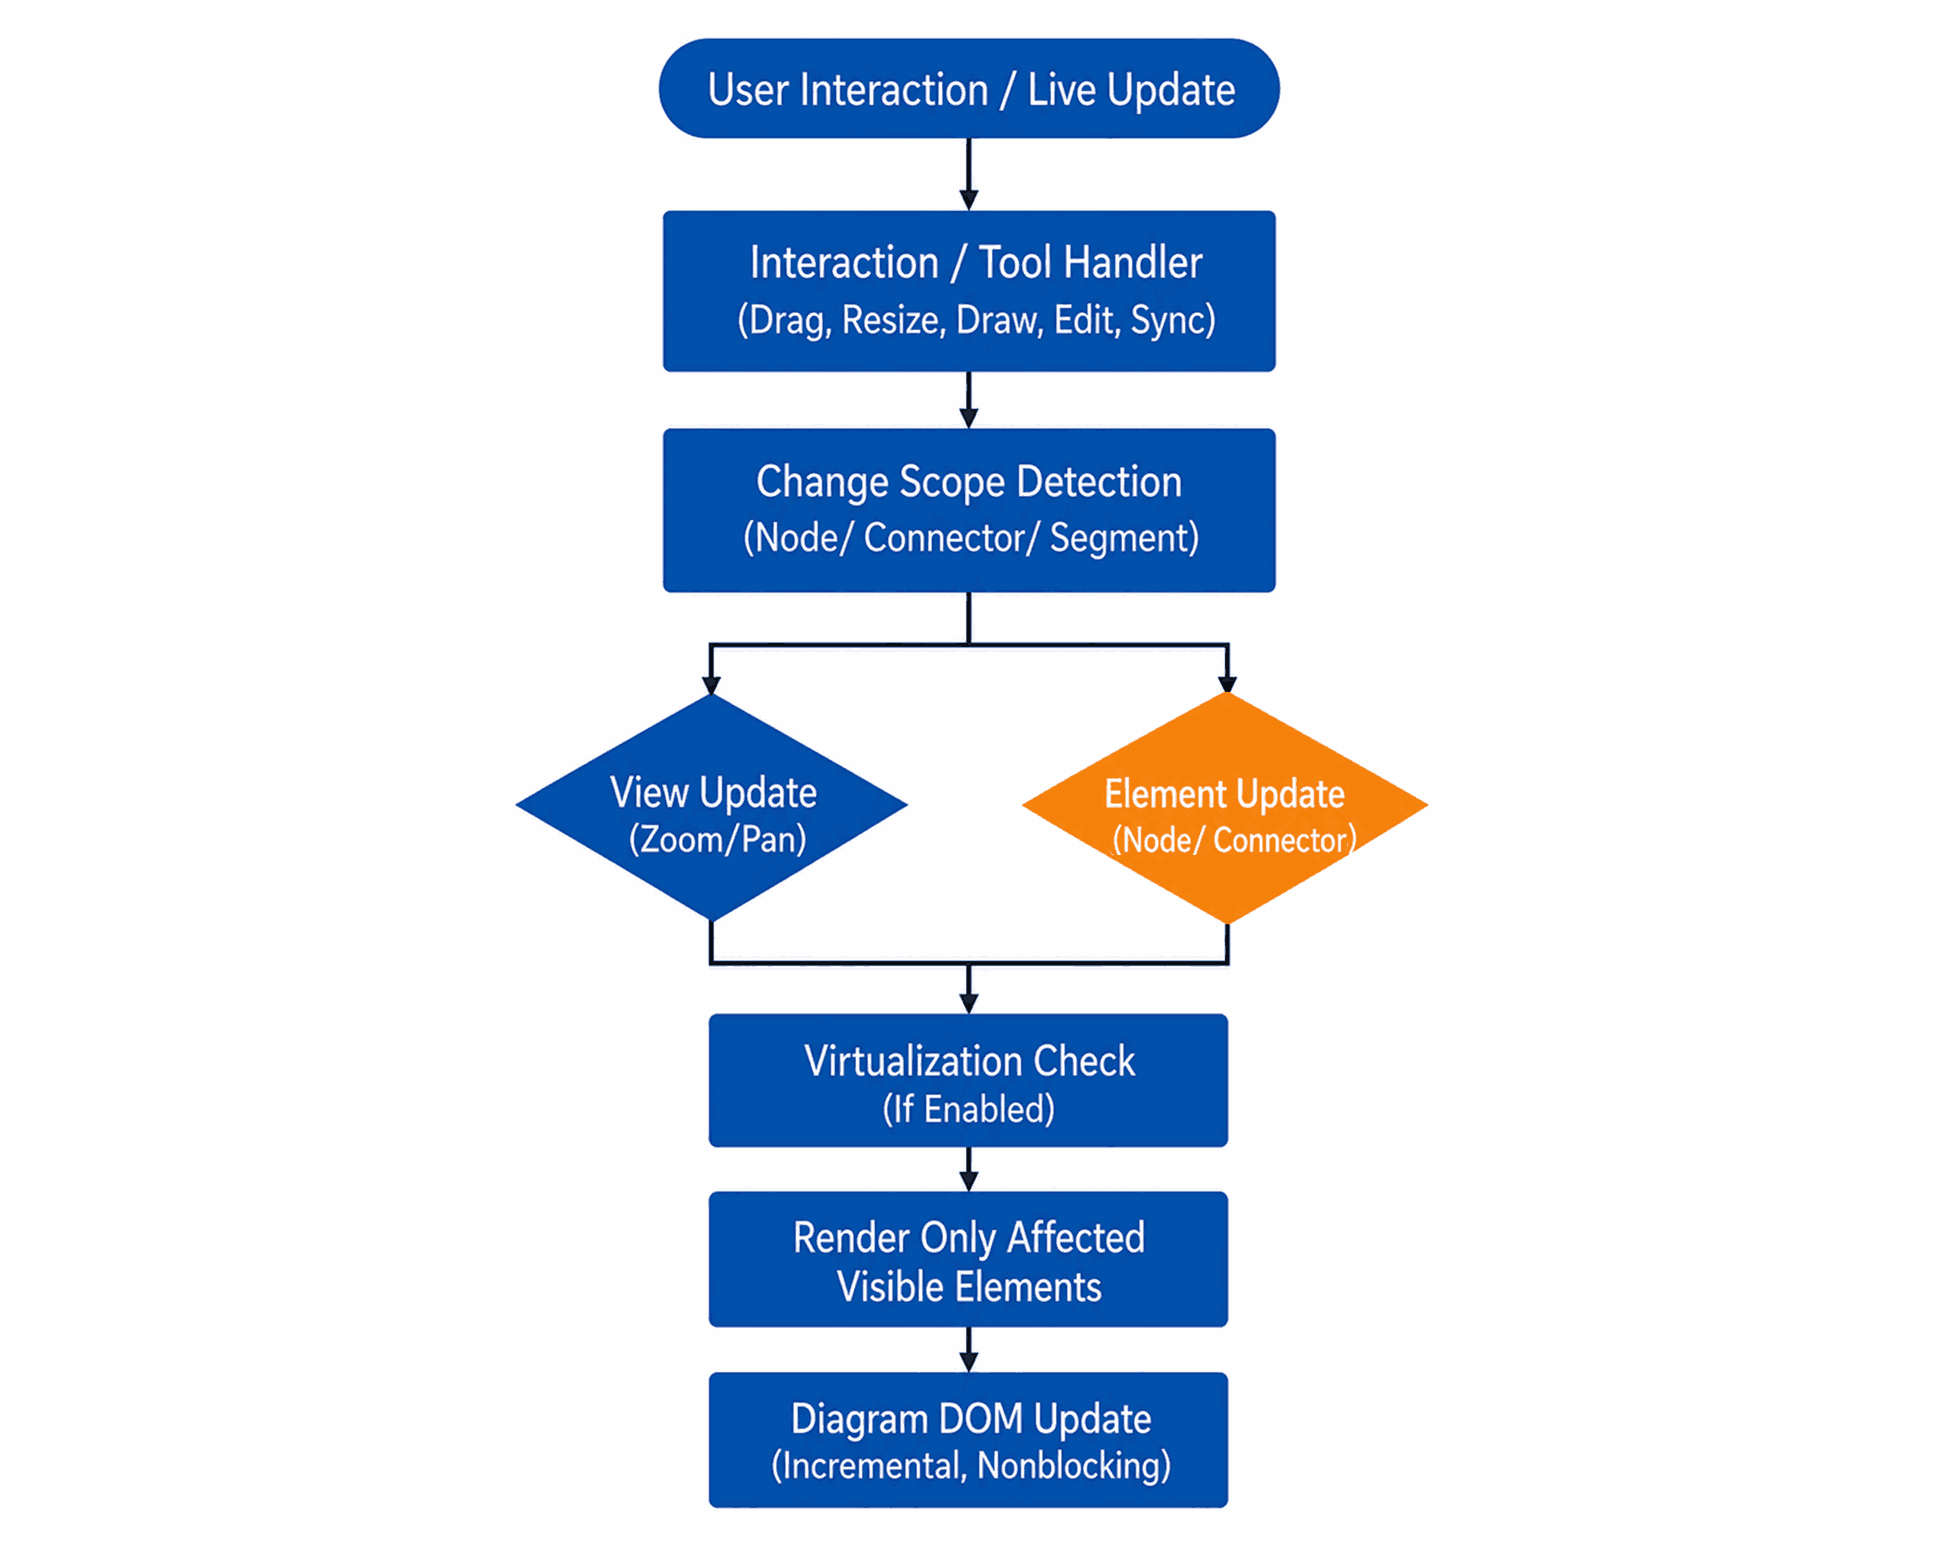
Real-time updates apply changes only to affected nodes, connectors, or segments instead of redrawing the full workspace. This supports live monitoring, workflow orchestration, dynamic process visualization, and collaborative editing while maintaining responsive interactions.
For high-frequency updates, validate the expected event rate together with dragging, resizing, zooming, and virtualization to ensure consistent performance in large diagrams.
| Real time scenario | Coverage | Rendering behavior |
|---|---|---|
| Single node updates (Drag/resize/rotate) | Fully supported | Only the targeted node is updated in real time; other nodes and connectors remain unchanged. |
| Single connector updates | Fully supported | Only the modified connector is updated; no diagram-wide redraw occurs. |
| Connector segment editing | Fully supported | Only the affected connector segment updates during interaction. |
| Real time collaboration (SignalR / WebSocket) | Fully supported | Only changed nodes or connectors are synchronized and rendered across users. |
| Continuous element creation | Fully supported | Nodes/connectors are added incrementally; existing content remains unchanged. |
| Tool precedence during live updates | Fully supported | Highest priority tool handles updates during live interactions. |
| Zoom and pan during real time interaction | Fully supported (view only) | Viewport transformations are applied; elements are not individually re-rendered (transformation-based update). |
| ZoomIncremental element creation events | Fully supported | Events trigger each node and connector creation individually. |
| Real time updates with virtualization | Fully supported | Only visible nodes and connectors participate in rendering and updates; off screen elements are virtualized. |
Scalability beyond row count
Evaluate node count, connector density, workspace dimensions, interaction frequency, and the number of Diagram instances together. Virtualization renders only visible elements to support large workspaces while keeping the loaded model in browser memory. Multiple Diagram instances operate independently without sharing rendering state or increasing overall DOM cost.
| Scalability dimension | Coverage | Architectural behavior |
|---|---|---|
| Node count scalability | Supports very large node sets using diagram virtualization. | Only nodes visible in the viewport are rendered, limiting DOM growth. |
| Connector volume | Scales alongside nodes. | Connectors linked to visible nodes are rendered; others are virtualized until visible. |
| Large node and connector datasets | Viewport based virtualization. | Rendering and interaction remain stable as diagram size increases. |
| Multi-diagram dashboards | Multiple diagrams supported in dashboard layouts. | Each Diagram maintains its own dataset and rendering pipeline. |
| Dynamic nodes and connectors | Runtime adding and removing is supported. | Diagram structure updates incrementally without full component reinitialization. |
| Grouping in large diagrams | Grouping and ungrouping is supported. | Groups operate as containers without breaking virtualization behavior. |
| Interaction scalability | Supports drag, resize, select, and edit operations at scale. | User actions affect only targeted elements, not the full diagram. |
| Zoom and pan performance | Smooth zooming and panning is supported. | Zooming and panning are applied at the diagram view level, ensuring smooth interaction for large diagrams. |
| Undo / redo operations | Undo and redo are supported for large diagrams. | Only state changes are tracked instead of full diagram snapshots. |
4
Security and compliance
Understand the security responsibility boundary between the Diagram (presentation layer) and application-owned functions such as authentication, authorization, data protection, and audit logging. Review deployment security characteristics, export controls, compliance certifications, and vulnerability management to validate organizational readiness and regulatory compliance.
Security architecture and responsibilities
Separate Diagram behavior from the controls owned by the application, back end, and infrastructure.
Security responsibility matrix
Use this matrix to assign security responsibilities before implementation. The Diagram is a client-side UI component with a well-defined role within the application’s security model. The matrix identifies which protections are provided by the component and which remain the responsibility of the host application, including authentication, authorization, sanitization, and auditing.
| Security concern | Component behavior | Application responsibility |
|---|---|---|
| Cross-site scripting (XSS) | Renders nodes, connectors, labels, annotations, and templates using values provided by the application. The Diagram component does not perform HTML sanitization. | Validate and sanitize user-supplied content on the server; restrict unsafe HTML; apply strict template controls. |
| Authentication | Does not manage user identity, credentials, or session state. | Implement authentication using identity providers and manage session/token lifecycle. |
| Authorization | Does not enforce access control. | Evaluate permissions, enforce access control rules, and determine which data is visible to users. |
| Sensitive data handling | Displays values supplied by the application. | Apply masking, redaction, or field-level protection to sensitive data before rendering. |
| Editing and interaction events | Triggers client-side APIs for selecting, moving, resizing, rotating, connecting, and editing elements. | Enable or disable editing features based on permissions. |
| Export controls | Supports exporting images but does not apply export restrictions or masking. | Manage export permissions, mask sensitive fields in exports, and restrict unauthorized downloads. |
| Audit logging | Emits events for node and connector creation or deletion; node drag, resizing, and rotation actions; label edits; connection (link) updates. | Capture events and forward audit records to logging or SIEM systems. |
| Transport security | Uses the host application's network layer for all requests and does not initiate independent network communication. | Configure TLS, certificates, and secure API endpoints for all backend communication. |
| Content security policies (CSPs) | Compatible with strict CSP configurations. | Enforce CSP headers and policies at the application level. |
| Dependency security | Distributed as a versioned package through standard package managers. | Maintain dependency update policies and monitor vulnerabilities using standard tooling. |
Security architecture overview
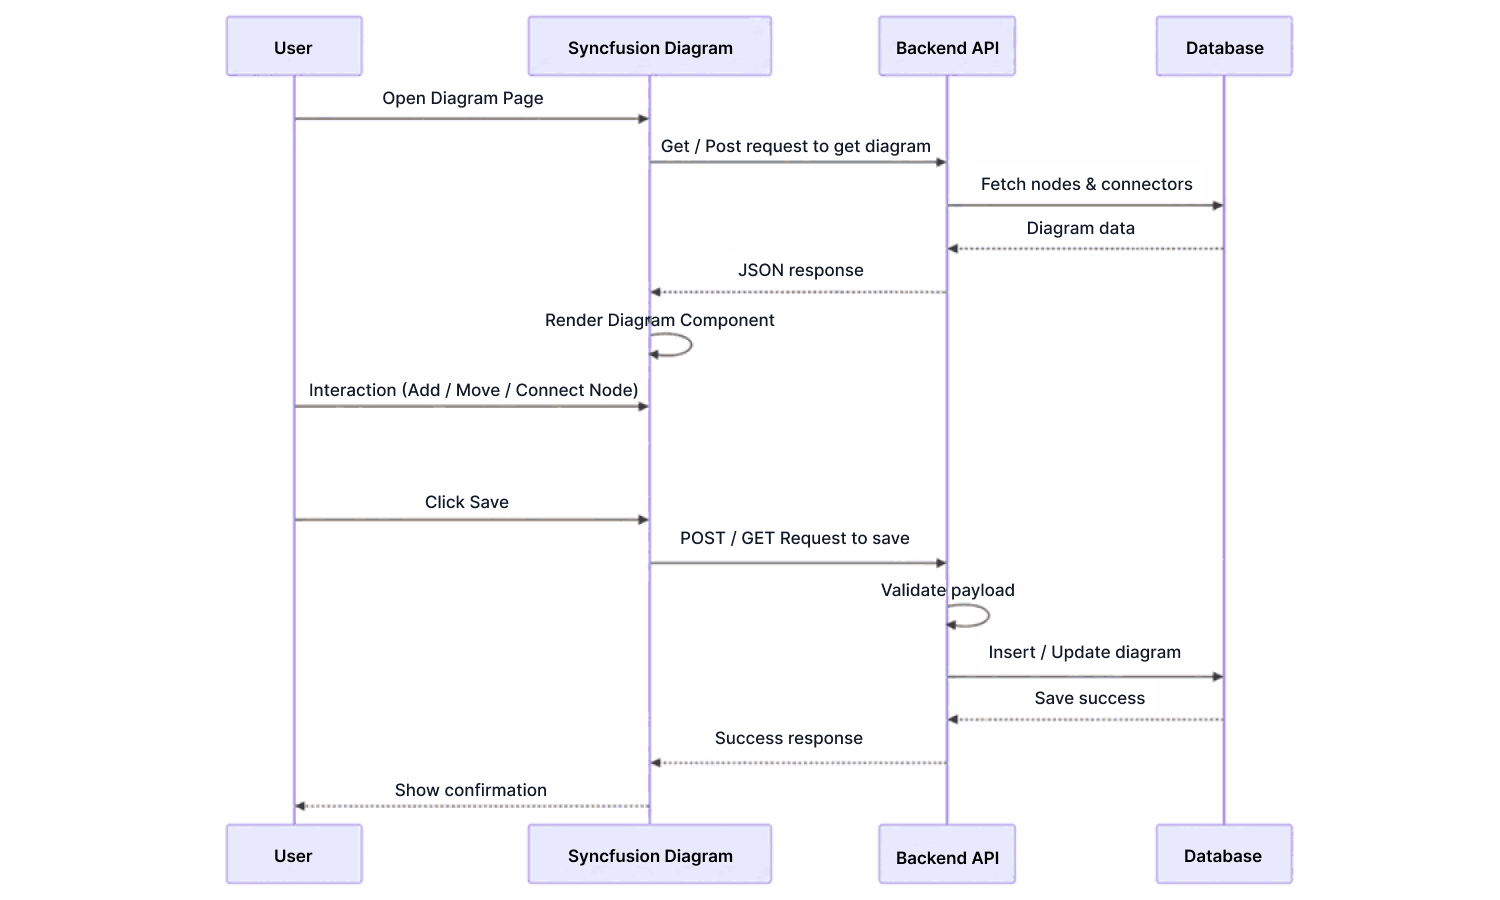
The Diagram renders application-provided models in the browser as part of the front-end UI layer and emits editing events to the application’s business logic. Data access, persistence, validation, authorization, and other server-side operations remain outside the component and are handled by the application’s API and back-end services.
Trace representative load, edit, save, and export workflows through the application and back end to verify that security controls are enforced outside the Diagram and that the component remains within its intended client-side security boundary.
Data flow and network behavior
Diagram-related data interactions, including loading, adding, updating, and removing nodes and connectors, use the application’s existing APIs and standard HTTP communication layer. The component does not create a separate network channel or networking mechanism.
All routing, authentication, credentials, validation, monitoring, WAF, API gateway, and back-end access controls remain the responsibility of the host application.
Network control ownership
- API routing and endpoint exposure are defined by the application’s back-end services.
- Authentication tokens and credential headers are attached by the application before any diagram-related request is sent.
- Back-end services perform validation and enforce authorization checks when diagram data is stored or retrieved.
- Network security controls such as web application firewalls (WAF), reverse proxies, API gateways, and monitoring systems are implemented at the organization’s infrastructure boundary.
OWASP security responsibility context
Map the OWASP security risks that are applicable to the Diagram component to the system layer responsible for mitigating them. As a client-side visualization component, the Diagram does not implement application-level security controls such as authentication, authorization, input validation, logging, or server-side protections, which remain the responsibility of the application, back end, or build pipeline.
| OWASP risk area | How it relates to the Diagram | Responsibility |
|---|---|---|
| A01: Broken access control | The Diagram component renders the data provided by the application. It does not evaluate or restrict access to diagrams or diagram elements based on user permissions. | Access control decisions must be enforced by the application and back-end services. |
| A03: Software supply chain failures | The Diagram component is integrated as an external frontend library, making its security dependent on verified package sources, controlled versioning, and secure distribution. | The organization must manage dependency updates, use trusted sources, verify package authenticity, and enforce secure build and deployment pipelines. |
| A04: Injection | Diagram annotations, and custom templates may contain text that originates from user input or API responses. | Applications should validate and sanitize all untrusted inputs before binding them to the Diagram. |
| A05: Authentication failures | The Diagram does not manage user identity, authentication tokens, or sessions. | Authentication flows are implemented by the application and identity provider. |
| A06: Software or data integrity failures | Distributed as an npm package. Supply chain integrity depends on package provenance, version pinning, and lock file management. | Organizations should pin versions, use lock files, and validate package checksums through internal registry mirroring. |
| A07: Security logging and alerting failures | Diagram interactions such as element drag, resize, rotate, and connection changes can represent user actions that may require auditing. | Applications may capture Diagram interaction events and integrate them with logging, monitoring, or SIEM systems. |
Application and data security
Validate permissions, data flow, deployment behavior, and export policy in the target application.
Authentication and authorization integration
The application controls whether a Diagram is visible, which elements users can edit, and which changes may be persisted. The Diagram is a client-side presentation component and does not perform authentication, credential validation, session management, or authorization decisions. Client-side constraints improve the user experience but do not replace server-side authorization, which must be enforced by the host application and back-end services.
| Security requirement | Diagram capability | Security enforcement layer |
|---|---|---|
| Diagram visibility control | Diagrams are rendered only when the application provides diagram model properties. | Application layer: Diagram loading and rendering are controlled based on user role or session context. |
| Edit permissions | Editing features such as resizing and rotating can be enabled or disabled using node constraints, and dragging can be controlled using connector constraints. | Application layer: Editing options are configured based on permission evaluation before rendering. |
| Element level editing | Emits interaction events (e.g., drag, resize, connect) that can be used to trigger validation logic. | Enforce validation at the application layer during interaction events before persisting changes. |
| Sensitive data masking | The Diagram component renders annotations, templates, and metadata exactly as provided by the application. It does not perform masking or data protection automatically. | Back-end or application layer: Masking should be applied before binding diagram data; server side masking is preferred for regulated data. |
| Read only diagram mode | All interactive editing capabilities can be disabled. | Application layer: Read only mode configured based on role or session context. |
| Change and interaction audit capture | Diagram emits events for element creation, deletion, movement, and connection updates. These events can be used by the application to track user interactions and implement audit logging. | Application layer to SIEM or audit log: Application listens to Diagram events and forwards audit records to the logging system. |
| Authenticated API communication | Diagram does not make direct API calls; persistence is handled by the application. | Application layer to back-end API: Application attaches authentication headers and the back end validates tokens for all diagram related requests. |
Deployment security characteristics
The Diagram’s deployment security properties are fixed at the architectural level. These characteristics are inherent to the component design and are not configuration options that can be disabled or misconfigured.
| Deployment characteristic | What it means |
|---|---|
| No external runtime connections | The component performs no outbound calls to Syncfusion services or third-party endpoints during runtime. |
| CDN free self hosted deployment | All CSS and JS assets are bundled within the npm package — no CDN dependency at runtime. |
| Air gapped or closed network deployment | No network connectivity is required for the Diagram to function. License validation occurs locally and does not require internet access. |
| Internal registry installation | The npm packages can be installed from internal registries such as Nexus or Artifactory without access to the public npm registry. |
| CSP unsafe inline not required | No inline scripts or styles are injected at runtime. Styles are applied through external stylesheets. |
| CSP unsafe eval not required | The rendering and interaction pipeline does not use eval or function constructors. |
| No telemetry or analytics calls | No usage data, diagnostic information, or analytics are transmitted from the component. |
Export security
Diagram provides client-side export APIs. The application enforces permissions and access control, determining who can export and which masked or authorized content is included in exported files.
| Export security concern | How it is addressed | Enforcement location |
|---|---|---|
| Who can trigger an export | Export actions are triggered by the application through API calls and controlled based on user roles or permissions logic. | Application layer |
| What data appears in exports | The export output reflects the data provided to the Diagram by the application. Any transformations or masking applied by the application are included in the exported result. | Application layer |
Compliance and security assurance
Collect current certification, vulnerability-management, and runtime-verification evidence for procurement and deployment approval.
Compliance certifications
Syncfusion holds active, independently audited compliance certifications relevant to enterprise and regulated industry procurement. These certifications document the vendor’s security, privacy, and operational controls, are verified by third party auditors, and serve as formal evidence for organizations conducting vendor evaluation and procurement.
| Certification or standard | Coverage | Procurement reference |
|---|---|---|
| SOC 2® Type 2 | Independently audited and actively maintained controls for enterprise security needs. | SOC 2® Type 2 overview |
| GDPR | Documented GDPR-aligned data-processing practices suitable for privacy reviews. | GDPR overview |
| WCAG 2.1 AA (accessibility) | Components tested for WCAG 2.1 AA; documentation available per component set. | Accessibility standards |
| ISO 27001 | Contact Syncfusion enterprise team for current certification status. | Contact sales team for certification information. |
| Section 508 | WCAG 2.2 AA conformance serves as the basis for Section 508 alignment; formal Section 508 documentation available through Syncfusion enterprise procurement. | Section 508 documentation |
Vulnerability management
Syncfusion maintains a vulnerability management process that identifies, remediates, and communicates security fixes to customers. Security fixes are delivered through standard product releases and supported by a responsible disclosure process for reporting potential vulnerabilities.
| Vulnerability management aspect | Coverage | Where to verify |
|---|---|---|
| Responsible disclosure policy | Publicly documented process with a defined channel for reporting security findings by external researchers. | Responsible disclosure |
| Security patch delivery | Security fixes delivered through regular product releases distributed via the standard package distribution channels. | Release notes |
| Security fix documentation | Release notes document product fixes and identify the versions in which issues were addressed. | Release history |
| Enterprise security escalation | Report security issues through Syncfusion support channels, with enterprise customers receiving priority handling based on their support agreement. | Support SLA |
| Dependency vulnerability monitoring | Third-party dependency updates and security patches are incorporated through the regular product maintenance and release process. | Release notes |
Explore our blog on achieve regulatory compliance to understand how Syncfusion components maintain compliance standards.
Security assurance statements
The following statements describe the security characteristics of the Diagram component and related vendor security practices. These statements can be verified through the methods listed below.
| Assurance statement | Verification method |
|---|---|
| The Diagram component does not initiate outbound network calls to Syncfusion or third-party services during normal runtime operation. | Browser DevTools: Inspect the Network tab during live Diagram operations. |
| No inline styles are injected into the DOM by the component at runtime. | Browser DevTools: Review the Elements panel and check the CSP violation log. |
| No eval or function constructor usage is used in the rendering pipeline. | Inject test payload values into node labels or annotations; observe the DOM to ensure the script is not executed. |
| The component does not manage credentials, authentication tokens, or session storage. | Inspect application storage via DevTools Storage, Cookies, and Session panels. |
| Vendor security documentation like SOC 2® Type 2, GDPR, and NIST 800-53 compliance information is available to enterprise customers. | Contact Syncfusion enterprise support or procurement teams for compliance documentation packages. |
| WCAG 2.1 AA accessibility conformance documentation is available for the component. | Accessibility documentation |
| Security fixes and dependency updates are delivered through the standard product release cycle. | Release history and Release notes |
5
Interactive live demos
Use the interactive live demos to assess the component in representative usage scenarios. Explore key capabilities, interactions, configuration options, and runtime behavior to validate functional fit and user experience against application requirements.
Try our Live Demo
6
Evaluation checklist
Complete this checklist with evidence from the target application, not only vendor demonstrations. Record assumptions, conditions, owners, and unresolved risks beside each item.
01. Runtime compatibility
- The production React version maps to a supported Syncfusion version.
- Next.js App Router client boundaries and hydration behavior pass in the real route.
- Every required browser and device class is covered and tested.
02. Data and persistence architecture
- The complete logical diagram size can reside in browser memory, or an application-level partial-loading strategy is approved.
- Node, connector, hierarchy, layout, annotation, and metadata contracts are defined.
- Serialization, granular persistence, versioning, and concurrency ownership are documented.
- Authenticated load and save operations pass with production-shaped payloads.
03. Integration and extensibility
- Required templates, handles, tooltips, layouts, interactions, and design-system rules are proven.
- Events and methods cover validation, selection, editing, undo or redo, export, persistence, and observability.
- Micro-frontend package versions and CSS are governed at the shell level.
- Multiple diagram instances remain isolated and coordinated only through application state.
04. Performance and scalability
- Viewport virtualization was profiled with representative nodes, connectors, templates, and workspace dimensions.
- Drag, resize, rotate, connect, zoom, pan, selection, and grouping remain responsive at target scale.
- Real-time or collaborative updates pass long-session, conflict, and reconnect tests.
- The largest required export completes within browser memory and duration limits, or a separate server solution is approved.
05. Security and compliance
- Every persisted interaction is reauthorized and validated by the back end.
- Untrusted node, annotation, tooltip, metadata, and template content is sanitized before rendering.
- Tenant isolation, sensitive-data masking, and export governance are implemented.
- Production CSP behavior is verified with the exact custom templates and features.
- Current accessibility, compliance, vulnerability, and support evidence has been reviewed.
06. Final decision
- Every mandatory criterion has a recorded pass, conditional pass, or fail result.
- All conditional passes have an owner, mitigation, evidence requirement, and deadline.
- The POC covers the largest diagram, highest-risk interaction, security boundary, collaboration path, and export workflow.
- Unresolved red flags are not hidden by broad feature coverage.
7
Frequently asked questions
These high-relevance questions address common architecture, integration, performance, AI, security, and procurement concerns.
Can the React Diagram handle tens of thousands of nodes and connectors?
The React Diagram component uses viewport-based virtualization, where only elements visible in the current view participate in rendering. Regardless of total diagram size, the DOM footprint remains bound by the viewport, enabling large diagrams to render and interact smoothly.
Does the React Diagram support partial or region-based server loading?
The React Diagram supports viewport-based virtualization, which loads and processes diagram objects as they enter the visible viewport. However, this is client-side UI virtualization and does not provide built-in server-side region-based or partial data loading. If diagram data must be fetched from a server based on a region, the React application must implement that data-fetching logic and supply the retrieved nodes and connectors to the diagram.
How does the React Diagram support real-time and collaborative updates?
The React Diagram supports real-time collaborative editing through incremental diagram updates and provides guidance for SignalR-based collaboration. The React application and backend are responsible for configuring communication, managing sessions and persistence, enforcing access control, and handling versioning and conflict resolution.
Does the React Diagram automatically save edits to the server?
No. The React Diagram raises events for actions such as dragging, resizing, rotating, connecting, and editing. The React application determines when to serialize or submit changes and must handle authentication and server-side validation.
Can a React Diagram be saved and recreated later?
Yes. React Diagram supports serializing a diagram to JSON and deserializing it to recreate the diagram later. The React application is responsible for managing storage, versioning, schema migration, concurrency, and authorization as required.
Can the React Diagram work while an application migrates from the Next.js Pages Router to the App Router?
Yes. The React Diagram is documented for both Pages Router and App Router integration patterns. Validate mixed-router deployments during migration, particularly hydration, data loading, and code-splitting behavior.
Validate both paths in the production build, particularly hydration, data loading, and route-level code splitting. See the Next.js integration guide.
Does the React Diagram sanitize node, annotation, or template HTML?
No. The React Diagram does not perform HTML sanitization. The React application must validate and sanitize untrusted node, annotation, or template content before binding or rendering it.
Does the React Diagram transmit application data to Syncfusion or third-party services at runtime?
The React Diagram operates through the application’s configured API endpoints and documented deployment model. Verify runtime network behavior using browser DevTools as part of security review.
Can the React Diagram operate under a strict Content Security Policy?
The React Diagram is designed to operate within CSP-enforced applications. The application remains responsible for configuring and enforcing CSP policies. Validate the production build under the organization’s CSP configuration and review CSP violation logs during testing.
How are permissions enforced for node and connector editing in the React Diagram?
React Diagram can restrict node and connector interactions using constraints, such as disabling dragging, resizing, rotation, deletion, or connection editing. These are client-side interaction controls rather than authorization mechanisms. For secure applications, the backend should independently validate user permissions and revalidate any saved node, connector, relationship, or associated metadata changes.
Can multiple React Diagram run in one dashboard or micro-frontend shell?
Yes. Multiple React Diagram component instances can run within the same React dashboard or micro-frontend shell. Each instance has isolated state and lifecycle. Cross-diagram synchronization belongs to the application, and the shell should enforce a shared singleton to prevent version duplication across micro-frontends.
How does the React Diagram handle large diagram exports?
When exporting large diagrams, the React Diagram component performs client side exporting based on the rendered diagram content. There is no direct or built in support for full server side diagram export. In specific scenarios involving HTML or SVG nodes, server side Blink rendering can be used at a sample or application level to convert rendered HTML content into images, but this is not a native Diagram feature and must be implemented separately.
What is the AI responsibility boundary for the React Diagram?
Text-to-flowchart, text-to-mind-map, and text-to-UML sequence examples are application-layer integrations. The React Diagram does not include an AI runtime or call a model service; the application owns model routing, prompt and data controls, authorization, validation, review, and audit logging.
8
Resources
Use these references after reviewing the guide and FAQs to continue implementation, validation, troubleshooting, and design evaluation.
- React Diagram documentation- Start with installation and core configuration.
- Knowledge base- Review task-specific solutions and troubleshooting guidance.
- Tutorial videos- Follow Diagram feature walkthroughs in video format.
- Feature walkthrough video- See a guided product overview.
- Live interactive demo- Explore Diagram editing and interaction in the browser.
- Feature web story- Review a brief visual feature summary.
- Figma UI kits- Check available design assets.







