React Pivot Table - Evaluation Guide
Evaluate the Syncfusion React Pivot Table for Enterprise Adoption
Syncfusion React Pivot Table support financial analysis, sales reporting, healthcare analytics, retail intelligence, and self-service business reporting. This guide turns the supplied technical evidence into an evaluation sequence while retaining the important tables, benchmarks, security boundaries, limitations, and references.
Start with the capability highlights, then follow the evaluation framework to confirm fit for the target analytical workload.
Quick evaluation framework
Evaluate in this order so data-processing, runtime, or security constraints are found before advanced report customization begins.
| Order | Evaluation area | What to assess | How to verify | Decision impact |
|---|---|---|---|---|
| 1. | Runtime fit | React, Next.js boundaries, browsers, package model, and web-only scope | Match the production environment to the compatibility evidence and test the real route. | Confirms runtime support for React, Next.js, browsers, and the web-only deployment model. |
| 2. | Analytical architecture | Relational data, OLAP, client pivot engine, server-side pivot engine, and report model | Prototype with production-shaped dimensions, measures, hierarchies, and security rules. | Confirms support for relational, OLAP, client, and server-side pivot engines. |
| 3. | Integration and extensibility | APIs, adaptors, authentication, state, field list, templates, events, and micro-frontends | Connect a representative service and implement one end-to-end analytical workflow. | Confirms integration coverage for APIs, adaptors, authentication, state, field list, templates, events, and micro-frontends. |
| 4. | Performance and scalability | Rows, columns, aggregation cost, drill operations, live refresh, dashboards, and export | Run repeatable tests on target hardware and record timings, memory, and DOM behavior. | Confirms performance coverage for rows, columns, aggregation, drill, refresh, dashboards, and export. |
| 5. | Security and procurement | Field access, tenant isolation, drillthrough, CSP, exports, compliance, and support evidence | Validate runtime behavior and review current organizational documentation. | Confirms component coverage for field access, exports, and drillthrough, alongside application-level controls for tenant isolation, CSP, and compliance. |
| 6. | Final decision | Mandatory conditions, limitations, evidence, ownership, and unresolved risks | Record pass, conditional pass, or fail for every required criterion. | Records pass, conditional pass, or fail for every required criterion. |
AI integration and responsibility
The React Pivot Table can host AI-assisted analysis through templates, toolbar extensions, and events. The supplied examples include AI-assisted pivot analysis and smart pivot.
AI responsibility boundary The React Pivot Table has no AI runtime or external model calls. Your application owns the model endpoint, authentication, data authorization, audit logging, human review, tenant isolation, and export controls.
1
Architecture compatibility
When adopting a third-party Pivot Table component for an enterprise application, seamless integration with the existing architecture with minimal integration effort. This page covers Syncfusion React Pivot Table compatibility with frameworks, React versions, build tools, state management, SSR, micro frontends, browsers, module formats, theming, and testing infrastructure. Each section includes links to the relevant versioned documentation for further reference.
Framework, build, and application architecture
Aligns the React Pivot Table with the host framework, React version, SSR model, and supported browsers, establishing a smooth runtime fit before deeper build and integration evaluation.
Framework and environment support
The Pivot Table integrates as a standard React component across all major deployment environments, including Next.js App Router, Vite SPA, Remix, and micro front-end shells. Integration is consistent across environments, requiring minimal environment-specific configuration
| Deployment Environment | Syncfusion React Pivot Table Coverage |
|---|---|
| React 18/19 SPA | Supported with documented integration guidance. |
| Next.js App Router | Supported with documented integration guidance; requires use of a client component. |
| Next.js Pages Router | Supported with documented integration guidance. Stable across all Pages Router versions. |
| Vite SPA | Supported with documented integration guidance. Integrates as a standard package dependency. |
| Remix | Supported with documented integration guidance. Client-side hydration behavior is documented and reliable. |
| Gatsby SSG | Supported with documented integration guidance. Has static generation and hydrates correctly at runtime. |
| Electron | Supported with documented integration guidance. Runs inside Electron's renderer process as a standard React component. |
| Micro Front-End (single-SPA) | Supported with documented integration guidance. Runs as a standard, client-rendered React component inside single-SPA. |
| Micro Front-End (Module Federation) | Supported with documented integration guidance. Declare as a shared singleton at the shell level; one version loads across all teams. |
| Preact | Supported with documented integration guidance. |
Use the published system requirements as the versioned reference.
React version compatibility
The Pivot Table publishes a versioned React compatibility matrix with every release. This provides a documented reference that can be used for upgrade planning.
| React Version | Syncfusion Minimum Version | Approximate Release Year | Coverage |
|---|---|---|---|
| React 16 | Syncfusion v16 | 2018 | Fully supported and documented in the current release. |
| React 17 | Syncfusion v18 | 2020 | Fully supported and documented in the current release. |
| React 18 | Syncfusion v20 | 2022 | Fully supported and documented in the current release. |
| React 19 | Syncfusion v29 | 2025 | Confirmed compatible in the latest release notes. |
| React Strict Mode | No minimum version constraint. | — | Fully compatible. Validated for React Strict Mode behavior. |
| Organization-pinned React version | N/A | — | No known peer dependency conflicts in supported configurations. The Pivot Table consumes the host application's React version. |
| Future React major version planning | Reviewable in release history. | — | Historical adoption pace across React 17, 18, 19 provides evidence-based upgrade planning. |
SSR and server component integration
The Pivot Table renders as a client component in Next.js App Router and works alongside server-rendered pages, Streaming SSR, ISR, and Edge runtimes.
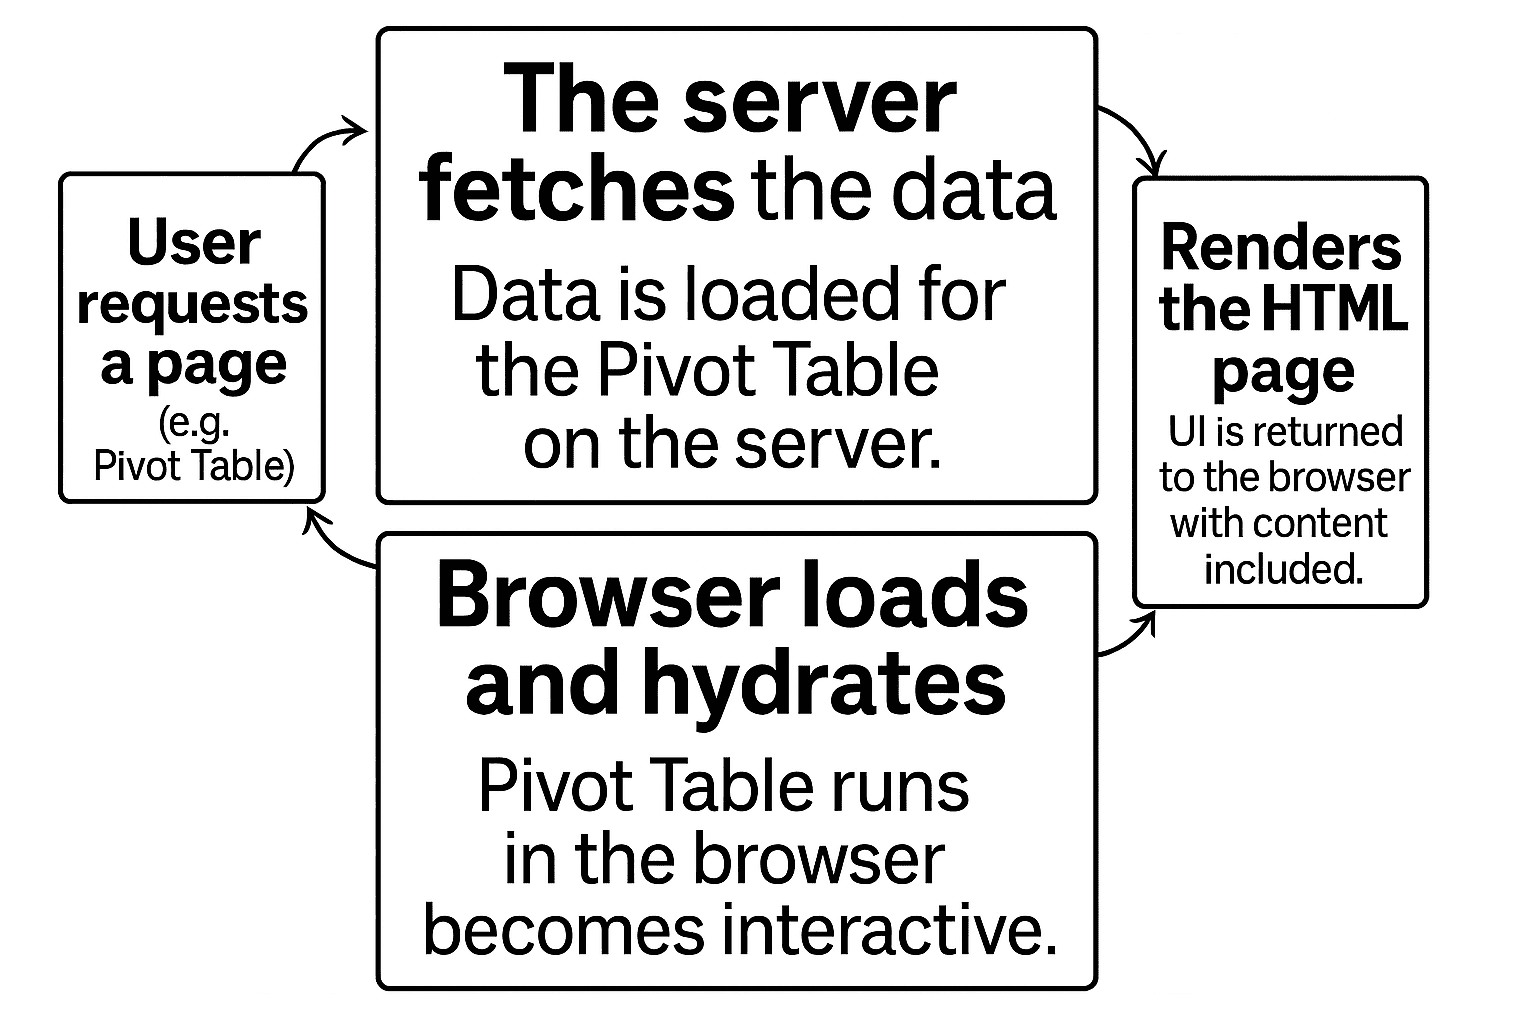
- Client boundary: place the Pivot Table inside a client component to avoid hydration problems.
- Streaming SSR: use it inside a Suspense boundary while report data loads for avoiding the blocking of full page render.
- ISR: validate hydration on regenerated pages with the application’s actual data-loading pattern.
- Edge runtime: the source reports no Node.js-only runtime dependency that blocks deployment.
Browser and runtime support
Use the versioned browser matrix for release and procurement planning. It covers all supported modern browsers, with details on accessibility, high-contrast rendering, and legacy browser limitations.
| Browser / Runtime | Syncfusion React Pivot Table Coverage |
|---|---|
| Chrome (latest) | Supported with documented integration guidance. |
| Firefox (latest) | Supported with documented integration guidance. |
| Safari (latest) | Supported with documented integration guidance. |
| Microsoft Edge (latest) | Supported with documented integration guidance. |
| Opera (latest) | Supported with documented integration guidance. |
| Internet Explorer 11+ (Legacy, EOL—June 2022) | Supported when the ES6 Promise polyfill is added, as noted in the documentation. |
Build, package, and application integration
Validates build compatibility, bundle efficiency, package distribution, and micro-frontend sharing for the React Pivot Table, supporting a predictable build pipeline and consistent deployment across teams.
Build compatibility
Distributed as a standard npm package, the component works with modern build setups and supports tree shaking in common bundlers. Only the imported feature modules appear in the production bundle, and the final output depends on the bundler, build configuration, and import patterns.
| Environment / Toolchain | Syncfusion React Pivot Table Support |
|---|---|
| Webpack | Supported with documented integration guidance. Works as a standard npm/ESM React package, integrates without requiring proprietary plugins. |
| Vite | Supported with documented integration guidance. ESM-compatible, integrates without configuration. |
| Turbopack | Supported via ESM export. Core rendering and data binding validated by Syncfusion under Turbopack's production pipeline. No Turbopack-specific plugin required. Teams should verify their own CSS strategy and SSR/Suspense configuration. |
| Nx / Turborepo (Monorepo) | Supported with documented integration guidance. Standard npm dependency declaration; no custom executors, generators, or monorepo-specific configuration required. |
TypeScript Strict Mode ("strict": true) |
Fully compatible. All public APIs, props, and event signatures are fully typed; no @ts-ignore suppressions required for standard usage. |
| Next.js (App & Pages Router) | Supported with documented integration guidance. Client-component usage where needed. |
| Create React App (legacy — deprecated) | Supported for existing projects. For new projects or migrations, Vite is the recommended replacement. The Pivot Table’s Vite integration guide applies directly with no Pivot Table changes required. |
Bundle efficiency
The Pivot Table ships with full tree-shaking support. Only the feature modules imported by the application are included in the production bundle. Bundle size numbers are versioned and published with every release.
The following interactive sample measures the bundle size for a specific feature combination. The table lists individual module weights for reference.
| Configuration | Approximate Gzipped Size |
|---|---|
| Base Pivot Table component | 1.12 MB |
| Grouping | 0.05 MB |
| FieldList | 0.05 MB |
| CalculatedField | 0.02 MB |
| Toolbar | 0.01 MB |
| ExcelExport | 0.01 MB |
| PDFExport | 0.01 MB |
| ConditionalFormatting | 0.03 MB |
| NumberFormatting | 0.01 MB |
| VirtualScroll | Included in base bundle or negligible size |
| Pager | 0.01 MB |
| GroupingBar | 0.04 MB |
| DrillThrough | Included in base bundle or negligible size |
Package distribution and module support
Package distribution bundles software into reusable packages for easy sharing and installation, while a module format defines the syntax used to structure and import code across environments.
| Module Format | Support | Notes |
|---|---|---|
| ESM | Supported with documented integration guidance. | Ships as the primary format (dist/es6). Used by default in Vite, Next.js, and Webpack 5 builds. |
| CJS (CommonJS) | Supported with documented integration guidance. | Compatible with legacy Node toolchains, Jest, and CommonJS-based module loaders such as RequireJS and SystemJS. |
| UMD | Supported with documented integration guidance. | Available as dist/[package-name].umd.min.js. Loadable in browsers via script tag, AMD, and CommonJS loaders. |
Inspect the published files on the npm package page.
Micro front-end and Module Federation compatibility
Configure the Pivot Table as a shared singleton at the shell level to prevent bundle duplication and version conflicts in Webpack Module Federation or single-SPA
| Micro Front-End Scenario | Syncfusion React Pivot Table Coverage |
|---|---|
| Multiple Pivot Tables on the same page | Each instance is designed to maintain independent state and avoid cross instance conflicts in standard configurations. |
| Module Federation shell (Webpack) | Shared dependency configuration is documented. Prevents bundle duplication and version conflicts across micro-apps. |
| Vite Module Federation | Supported via @originjs/vite-plugin-federation. Shared singleton configuration applies identically to Webpack MF. |
| Lazy-loaded route (React.lazy) | Compatible. No special configuration required. |
Application architecture integration
Aligns the React Pivot Table with the application’s state and theming model, supporting consistent styling and predictable state flow without imposing its own architecture.
State management neutrality
Data and report settings enter through props, while user actions are exposed through events. The component does not require a proprietary state layer or internal application-wide provider.
Theming and design system integration
Align your Pivot Table with your design system through CSS custom properties, offering 22 pre-built themes, design-token integration for automatic upgrades, and Theme Studio for custom variants.
- 22 built-in themes includes Fluent 2, Material 3, Bootstrap 5.3, Tailwind 3.
- Design token–ready via CSS variables keep themes current across upgrades without patching.
- Theme Studio generates exportable SCSS/CSS for independent maintenance.
| CSS Strategy | Coverage |
|---|---|
| CSS custom properties / design tokens | Supported with documented integration guidance. The Pivot Table exposes CSS variables for design token overrides. |
| Sass / SCSS variable override | Supported with documented integration guidance. Themes are built in SCSS and customizable through Theme Studio. |
| CSS Modules | Supported with documented integration guidance. Wrapper class scoping prevents global style conflicts. |
| Runtime multitenant theme switching | Partially supported. CSS file or class swaps work for basic scenarios; full brand customization requires Theme Studio. |
| Dark mode | Built-in dark variants for all themes with no custom CSS required. |
| Theme Studio | Supported with documented integration guidance. Wrapper exports SCSS/CSS without touching component source code. |
| Brand / design system alignment | Supported with documented integration guidance. Wrapper CSS variables and SCSS tokens cover typography, color, and spacing alignment. |
Watch out for Runtime theme switching is supported for basic scenarios; full brand customization requires Theme Studio.
CI/CD and testing compatibility
Reports the test runners and end-to-end tools that work with the React Pivot Table, so the existing CI/CD infrastructure can cover React Pivot Table features without additional setup.
| Testing Tool | Compatibility | Notes |
|---|---|---|
| Jest | Supported with documented integration guidance. | Blog Reference |
| Vitest | Supported with documented integration guidance. | Works with jsdom and happy-dom environments. |
| React Testing Library | Supported with documented integration guidance. | Standard DOM queries work. No Syncfusion -specific selectors needed. |
| Cypress | Supported with documented integration guidance. | E2E tests run against Pivot Table interactions without custom configuration. |
| Playwright | Supported with documented integration guidance. | Pivot Table elements accessible via standard locators. |
| Storybook | Supported with documented integration guidance. | Pivot Table renders correctly for visual regression testing. |
Try live demo and navigate to the Testing tab to explore testing approaches and validate implementations using code examples and test cases.
2
Integration and extensibility
Designed for enterprise architectures, the Pivot Table connects to organizational data sources, works with existing state management and security models, aligns with design systems, and requires no re-engineering of surrounding layers. This section covers data integration, authentication passthrough, API stability, extensibility, state management, programmatic APIs, and multi-instance behavior.
Data and back-end integration
Connects the React Pivot Table to application data sources and back-end services, supporting data-source adaptors, back-end frameworks, database connections, ORM compatibility, and authentication passthrough.
Data source integration
Select the adaptor according to the endpoint contract and the operations that must run remotely.
| Adaptor | When to use | Enterprise benefit |
|---|---|---|
| URL adaptor | Back end exposes standard REST APIs. | Works with any back-end technology; compatible with microservice and cloud-native architectures. |
| ODataV4 adaptor | Back end provides services compliant with OData V4. | Standardized query protocol for filtering, sorting, and paging, which reduces the need for a custom API surface and improves consistency across services. |
| Web API adaptor | Back end is built on ASP.NET Web API. | Provides optimized request and response handling for .NET enterprise applications and offers native alignment with the Microsoft ecosystem. |
| GraphQL adaptor | Back end exposes a GraphQL endpoint—Apollo, Node.js, Hot Chocolate. | Fetches only the fields the Pivot Table requires, reducing payload size in distributed and microservice architectures. |
| Web Method adaptor | Back end uses legacy ASP.NET web services (ASMX). | Modernizes the UI layer without replacing existing back-end systems and preserves investment in legacy enterprise infrastructure. |
| RemoteSave adaptor | Data is managed client-side with server-side persistence only. | Reduces API call volume; suitable for batch editing workflows and high-frequency UI interactions. |
| Custom adaptor | API follows a nonstandard or proprietary format. | Full control over request and response shaping; allows extending any built-in adaptor without building from scratch. |
Try live demo and navigate to the Integration tab, then select Adaptors chip to access related resources and examples.
Back-end framework coverage
Choose the adaptor from the endpoint protocol rather than the server language alone.
| Back end | Possible adaptors | Reason |
|---|---|---|
| Django REST framework | URL adaptor, custom binding | Django REST framework exposes standard REST endpoints, so the URL adaptor maps directly and the custom binding handles nonstandard field formats or auth schemes. |
| Express and Node.js | URL adaptor, GraphQL adaptor, custom binding | These back ends support both REST and GraphQL, and the adaptor selection depends on the endpoint type that the service exposes. |
| FastAPI | URL adaptor, custom binding | FastAPI exposes standard REST endpoints; the custom binding covers nondefault response envelope formats. |
| Flask and FlaskAPI | URL adaptor, custom binding | REST-based by default; the custom binding handles lightweight or nonstandard API conventions. |
| Next.js API routes | URL adaptor, custom binding | API routes behave as REST endpoints, so the URL adaptor applies directly. |
| GraphQL in Node.js | GraphQL adaptor, custom binding | The GraphQL adaptor formats queries for Node.js GraphQL servers; the custom binding handles schema variations. |
| GraphQL in Apollo | GraphQL adaptor, custom binding | The GraphQL adaptor formats queries for Apollo GraphQL servers; the custom binding handles schema variations. |
| GraphQL in Hot Chocolate | GraphQL adaptor, custom binding | The .NET GraphQL implementations integrate via the GraphQL adaptor, while the custom binding covers schema-specific deviations. |
| ASP.NET Web API | Web API adaptor, URL adaptor | The Web API adaptor is optimized for .NET response conventions; the URL adaptor applies where REST-only patterns are used. |
| Legacy ASMX | Web method adaptor, custom adaptor | The web method adaptor calls web method endpoints in legacy ASP.NET services without replacing the back end. |
Database integration
All data access goes through back-end API endpoints. It does not connect to databases from the client side. The following table maps each major database to its recommended adaptors
| Database | Possible adaptors |
|---|---|
| Microsoft SQL Server | URL adaptor, Web API adaptor, custom adaptor |
| MySQL | URL adaptor, custom adaptor |
| PostgreSQL | URL adaptor, custom adaptor |
| Oracle | URL adaptor, web API adaptor, custom adaptor |
| MongoDB | URL adaptor, web API adaptor, custom adaptor |
| Elasticsearch | URL adaptor, web API adaptor, custom adaptor |
| SnowFlake | URL adaptor, web API adaptor, custom adaptor |
Try live demo and navigate to the Integration tab, then select Databases chip to access related resources and examples.
ORM compatibility
The Pivot Table has no direct ORM dependency. Any ORM can be used when the API returns data in the selected adaptor contract.
Commonly used ORMs that work with the Pivot Table through back-end APIs include:
- Entity Framework Core
- Hibernate and Java Persistence API
- Django ORM
- SQLAlchemy
- Sequelize and Prisma
- Laravel Eloquent
- Dapper
- ADO.NET, raw SQL, and stored procedures
Authentication passthrough
Authentication headers—including JWT bearer tokens—are attached through DataManager and apply uniformly across data loading, drill, drillthrough, export, and server-side processing requests.
| Auth pattern | Support |
|---|---|
| JWT bearer token | Configured in the data manager and attached to every request. |
| OAuth 2.0 (PKCE and client credentials) | Token supplied by the application authentication layer and injected via data manager headers. |
| Token refresh | Handled via the data manager request interceptor. |
| Mutual TLS (mTLS) | Configured at the HTTP transport layer, which is below the data manager boundary. |
| Auth failure (401/403) | Surfaces via built-in failure event and the retry, redirect, and notification logic remain in the application layer. |
Review custom headers and DataManager middleware logic.
Advanced data processing models
Extends the React Pivot Table beyond relational data with OLAP, the server-side pivot engine, and API versioning, supporting multidimensional analysis, back-end scale, and stable upgrade planning.
OLAP data integration
The Pivot Table integrates with OLAP data sources that use multidimensional cube structures. Use OLAP mode when analytical data already resides in a cube and aggregation should remain in the cube engine.
| OLAP data source | Integration approach | Reason |
|---|---|---|
| OLAP cube data source | OLAP data source configuration | Connects to cube endpoints and retrieves pre-aggregated analytical data. |
Server-side pivot engine
Beyond standard relational data, the react Pivot Table supports advanced processing models for multidimensional analysis and large-dataset performance.
| Processing model | Integration approach | Reason |
|---|---|---|
| Server-side pivot engine | Configure using the url property in the data source settings. |
The back end processes pivot operations and returns summarized data. |
Versioning and API stability
Use the public API policy and migration guidance as release gates for upgrades.
| Change type | Policy |
|---|---|
| Breaking changes | Introduced only in major versions; not included in minor or patch releases. |
| New properties, events, and methods | Added in minor versions; backward compatible |
| Deprecations | Deprecated members remain functional through the deprecation window and are flagged with TypeScript @deprecated annotations. |
| Major version upgrades | Accompanied by a migration guide with before and after examples scoped to the published breaking change list. |
Extensibility model
It exposes visual layers as configurable extension points that accept standard React components. These APIs keep customizations stable across version upgrades without source-level changes. Template components are rendered by React, not through innerHTML or dangerouslySetInnerHTML. Applications should still validate and sanitize user-provided content rendered within templates.
Data presentation layer
This layer focuses on how data is displayed inside the Pivot Table.
| Extension point | What it replaces | Common use |
|---|---|---|
| CellTemplate | Default pivot value cell rendering (plain formatted text values in cells). | Customize how pivot value cells are displayed by adding icons, HTML, conditional formatting, or interactive UI elements beyond default text values. |
| TooltipTemplate | Default tooltip that shows value + row or column header information on hover. | Customize tooltip content for pivot cells or headers to show additional context, business insights, or formatted details beyond default value and headers. |
| Hyperlink customization | Default unclickable cell values. | Enable hyperlinks for row headers, column headers, value cells, and summary cells to support navigation to detailed reports or external resources. |
| Conditional Formatting | Default uniform cell styling. | Apply rule-based visual styling (such as colors, highlights, or thresholds) to emphasize important values and trends. |
| Number Formatting | Default numeric display. | Format numeric values such as currency, percentage, or custom formats to provide consistent data representation. |
Interaction and control layer
This layer controls how users interact with the Pivot Table through actions such as report manipulation, exporting, and view configuration.
| Extension point | What it replaces | Common use |
|---|---|---|
| ToolbarTemplate | Built in pivot toolbar (predefined actions like export, report management, chart/grid switch). | Create a fully customized toolbar UI with business-specific actions, replacing or extending default toolbar features such as export, filtering, and visualization controls. |
Loading state presentation layer
This layer controls how loading states are visually communicated to users during data processing.
| Extension point | What it replaces | Common use |
|---|---|---|
| SpinnerTemplate | Default loading indicator (“Loading…” spinner shown while pivot processes data). | Customize loading UI with loaders, progress indicators, or meaningful messages during data processing, virtualization, or refresh. |
Try live demo and navigate to the Integration tab, then select Extensibility chip to access related resources and examples.
Programmatic API: events and methods
The Pivot Table’s Event API and Method API provide fine-grained programmatic control over report definition, report configuration, calculated fields, and user interaction. All major lifecycle phases — initialization, report manipulation, drilling, editing, exporting, and rendering — emit strongly typed events that the application can subscribe to or augment through its own logic.
| Capability | Architectural implication |
|---|---|
| Data lifecycle interception | Interception is possible during data binding, aggregation, and rendering stages. This provides control for modifying, enriching, validating, or validation before display. |
| Runtime report manipulation via methods | Methods allow dynamic modification of rows, columns, values, filters, and calculated fields at runtime. |
| Drill interaction lifecycle | Events triggered during drill actions enable integration with detail views or external modules. There's support for hierarchical navigation and deeper data exploration. |
| Server-side query delegation | Filtering, sorting, grouping, and aggregation can be delegated to the back end, and this is compatible with any server-side data or OLAP query layer. |
| Data source integration | APIs bind to JSON, CSV, REST APIs, and OLAP sources. This enables integration across multiple data systems within a unified analytical layer. |
| Aggregation and calculation extensibility | Pivot aggregations and calculated fields are programmatically configurable and retrievable from the pivot engine. |
| Conditional formatting configuration | Styling rules are applied dynamically at render time, enabling visual differentiation without post-rendering CSS manipulation. |
| Centralized numeric formatting | Numeric representation (such as currency, percentage, and custom formats) is defined through centralized configuration. This ensures consistent and reusable formatting logic across multiple reports and components, without modifying raw datasets. |
| Hyperlink-driven navigation configuration | Event-driven interception around cell interaction enables dynamic hyperlink control at runtime, such as enabling, disabling, or modifying navigation behavior based on user interaction or data context. |
| Selection state control | Cell selection and interaction context can be accessed programmatically, with row, column, and aggregated value axis information (measure, aggregation, and computed value) exposed through events. |
| Cross-instance interaction | Pivot state and configuration can be synchronized across multiple instances programmatically, enabling coordinated updates and shared analytical views. |
| DOM-efficient large dataset rendering | When virtualization or paging is enabled, the Pivot Table renders only the data (rows and columns) required for the current viewport. |
| Column and layout control | The pivot layout, including rows, columns, values, filters, and chart views, can be reconfigured programmatically at runtime. |
| Programmatic data extraction | Aggregated values and underlying drillthrough data can be programmatically accessed or exported from the pivot engine. |
| User preference persistence | Pivot reports, including current layout, field arrangements, sorting, applied filters, and the expanded or collapsed states of fields, are serializable and restorable across sessions from any storage layer. |
| Exporting | Excel, PDF, CSV, and print operations can be triggered programmatically, preserving the current pivot state and formatting. Server side exporting supports generating native Excel Pivot Tables and CSV outputs with full interactivity, including aggregations, filtering, and drill capabilities. |
| Programmatic chart export | Chart visuals derived from pivot data can be exported through application logic, allowing the generation of reports without relying on UI interaction. |
| Programmatic chart print execution | Chart output can be printed directly through application logic while keeping its current look (labels, colors, layout). |
| Regional and language adaptation | RTL rendering and locale-aware formatting are provided. All UI string translations are configurable at the component level. |
| Toolbar and UI interaction control | Toolbar actions, field lists, and grouping bar interactions are configurable with built in and custom items. Interaction lifecycle events are interceptable. |
| Keyboard and accessibility control | Full keyboard navigation is supported, and keyboard events are exposed for custom interaction handling and accessibility compliance. |
| Audit trail support | Drillthrough and edit events provide full row, measure, and hierarchy context, making them directly mappable to analytics, auditing, or compliance logging pipelines. |
| Instance isolation | Each Pivot Table instance exposes its own API surface and internal engine state, allowing multiple instances to operate independently without shared or leaking state. |
Use the feature-rich interactive demo to test representative runtime changes.
State management compatibility
Integrates the React Pivot Table with the application’s existing state layer through standard props and events, so Redux, Zustand, TanStack Query, React Context, MobX, Jotai, and Recoil all work without wrappers.
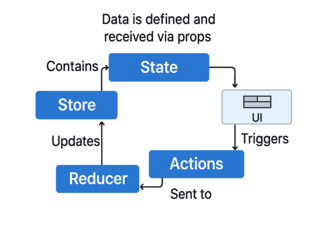
Compatibility matrix
| State library | How the Pivot Table connects |
|---|---|
| Redux and Redux Toolkit | A store value is passed as a data source, and the dispatch is called inside Pivot Table event handlers. |
| Zustand | A Zustand store slice is passed as a data source and the Pivot Table consumes it but never writes to the store. |
| TanStack Query and RTK Query | A query result is passed as a data source and the Pivot Table triggers a refetch via a built-in change event. |
| React Context | A context value is passed as a data source, and no provider wrapping is required inside the Pivot Table. |
| MobX | An Observable is passed as a data source and the Pivot Table re-renders on observable change. |
| Jotai and Recoil | An atom value is passed as a data source, following the standard React data flow. |
Try live demo and navigate to the State Management tab to explore different integration patterns and verify data flow in real time.
Multi-Pivot and micro-frontend integration
Isolates each React Pivot Table instance by default and supports cross-instance coordination, micro-frontend module boundaries, and lazy loading, so multiple React Pivot Tables and micro-frontend shells operate without interference.
| Runtime concern | How the Pivot Table behaves |
|---|---|
| State isolation between instances | Each Pivot Table instance maintains an independent report configuration, data source, and pivot engine state. Actions in one Pivot Table do not affect another. |
| Cross-instance coordination | Coordination between Pivot Table instances is handled through the application's state layer. The Pivot Table exposes events and configuration APIs, while the application manages synchronization logic. |
| Micro-frontend module boundaries | The Pivot Table operates as a self contained React component and can be independently added, updated, or removed within micro front-end modules without impacting other modules. |
| Lazy-load compatibility | The Pivot Table loads inside React.lazy and Suspense boundaries without hydration errors. It is compatible with on-demand, module-based loading to enable Pivot Table features in MFE shells. |
| Independent upgrade path | Each module can upgrade its Pivot Table version independently when the shell enforces a shared singleton. Version conflicts are resolved at the shell level, not at the module level. |
| Multi-pivot dashboard composition | Multiple Pivot Table instances can run simultaneously on the same page, each with independent rendering, aggregation, and interaction pipelines, with no cross-instance interference. |
The shell owns package-version resolution. Individual modules own report configuration and application-level coordination. Review the micro-front-end architecture guidance and inspect the final production bundle for duplicate packages.
3
Performance and scalability
Built for large business datasets and complex aggregations, the Pivot Table uses virtualization, paging, data compression, and server-side aggregation to maintain responsive interactions while minimizing client-side processing and supporting scale through back-end computation.
Rendering and data processing performance
Combines rendering modes, server-side operations, and DOM efficiency in the React Pivot Table to keep large analytical reports responsive across the entire workload.
Rendering performance modes
The React Pivot Table keeps large analytical reports responsive by combining virtual scrolling, single-page mode, paging, and data compression with a server-side pivot engine and DOM-efficient virtualization, letting teams choose where aggregation runs and how much of the matrix lives in the browser.
| Rendering mode | Typical data scenario | What it prevents | Architectural outcome |
|---|---|---|---|
| Virtual Scrolling | Large pivot result sets with vertical and horizontal navigation. | Full dataset rendered in DOM at once. | The DOM size remains bound to the visible viewport; memory usage is primarily determined by viewport size rather than dataset size. |
| Single-page mode | Very large datasets requiring maximum performance. | Adjacent page prerendering overhead. | It renders only the current viewport page without preloading adjacent pages, reducing computation overhead. |
| Paging | Large datasets managed via pagination. | Full dataset rendered in DOM at once. | Data is fetched and rendered page-by-page, keeping DOM size small and memory usage predictable. |
| Data Compression | Large datasets with many repeated values. | Redundant data processing and slow performance. | It operates on compressed unique data, minimizing iteration cost and improving rendering efficiency. |
Decision guidance: Virtual scrolling and single-page mode can be combined. Data compression can be paired with virtualization or paging.
Server-side operations
Only the processed pivot result required for the current view is transferred to the client while aggregation, grouping, sorting, and filtering are executed on the back end. Move analytical processing to the server when browser memory, performance, or data-governance rules prevent client processing.
| Server-side operation | Syncfusion React PivotTable coverage | Architectural benefit |
|---|---|---|
| Paging | Page request parameters are sent to the API, and the server returns only the computed pivot slice required for the current view. | Keeps the UI responsive even for very large datasets. |
| Sorting | Sort descriptors are transmitted to the API for execution and sorted pivot results are returned. | It enables sorting over datasets beyond browser memory limits. |
| Filtering | Filter predicates are sent to the back-end API and filtered pivot output is returned. | This prevents unnecessary data transfer and reduces client processing. |
| Grouping | The server performs data grouping (date, number, custom grouping). | This offloads data restructuring logic and improves scalability. |
| Aggregation | All aggregation logic (sum, count, average, etc.) is executed on the server. | This ensures accurate summaries across the full dataset and reduces client CPU usage. |
| CRUD operations | Data changes are processed and reflected in re-computed pivot results. | This maintains authoritative server-side data integrity and auditability. |
| Excel Export | The export configuration and current pivot state are sent to the API; the generated Excel file is streamed to the client. | This enables large‑scale exports without loading full datasets or generating files in the browser. |
| CSV Export | The export request and pivot configuration are sent to the API; the generated CSV file is returned to the client. | This supports efficient flat‑file exports while keeping client memory usage low. |
See the server-side pivot engine documentation.
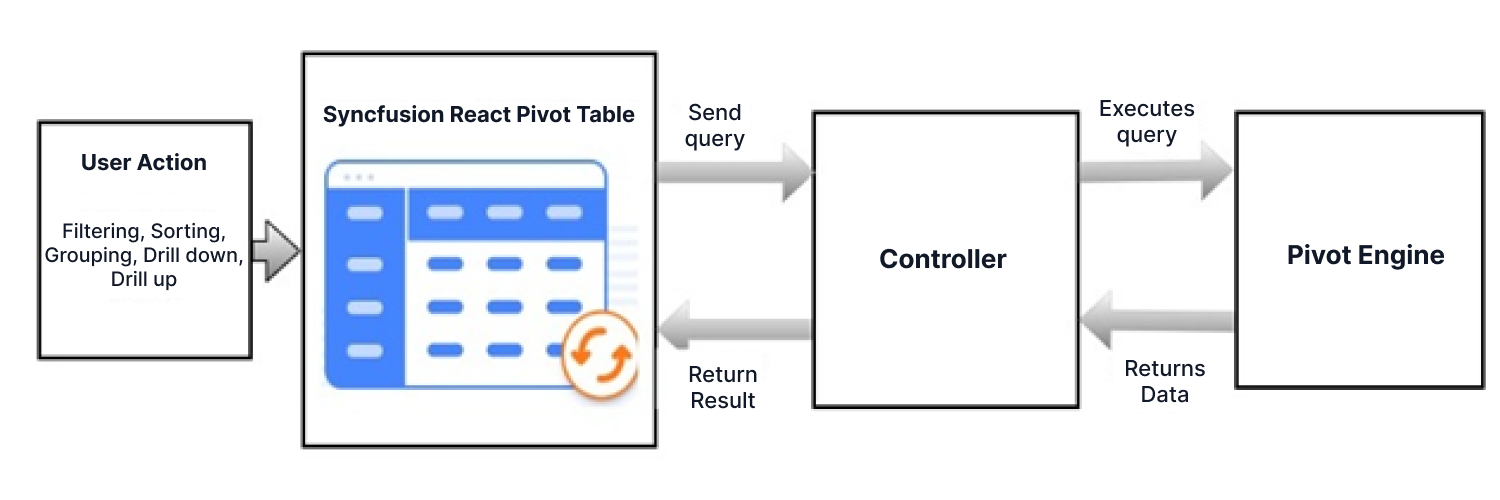
DOM efficiency
Only rows, columns, and value cells visible on screen are present in the DOM, so browser memory, layout cost, and scroll performance stay predictable as the dataset grows. Row and column group combinations can still expand the logical matrix into tens or hundreds of thousands of cells without affecting the DOM footprint.
| Dataset size | Dataset structure | Standard HTML table | Syncfusion React PivotTable (virtualization enabled) |
|---|---|---|---|
| 1,000 rows | 1,000 rows × 10 columns | ~10,000–15,000 DOM nodes (rows × columns). | ~300–600 DOM nodes (viewport rows × columns + structural elements). |
| 100,000 rows | 100,000 rows × 10 columns | ~1,000,000+ DOM nodes, causing significant browser slowdown. | ~300–600 DOM nodes, constant regardless of dataset size. |
| 1,000,000 rows | 1,000,000 rows × 10 columns | The browser typically becomes unresponsive due to DOM size. | ~300–600 DOM nodes, which are unchanged even at a very large scale. |
| Memory footprint at a large scale | 1 million rows × 10 columns | Memory grows linearly with dataset size. | Memory is determined primarily by viewport height. |
| Scroll performance | 1 million rows × 10 columns | Scroll performance degrades due to layout recalculation across large DOM trees. | Stable; only viewport rows participate in layout and paint. |
Figure: DOM footprint under virtualization
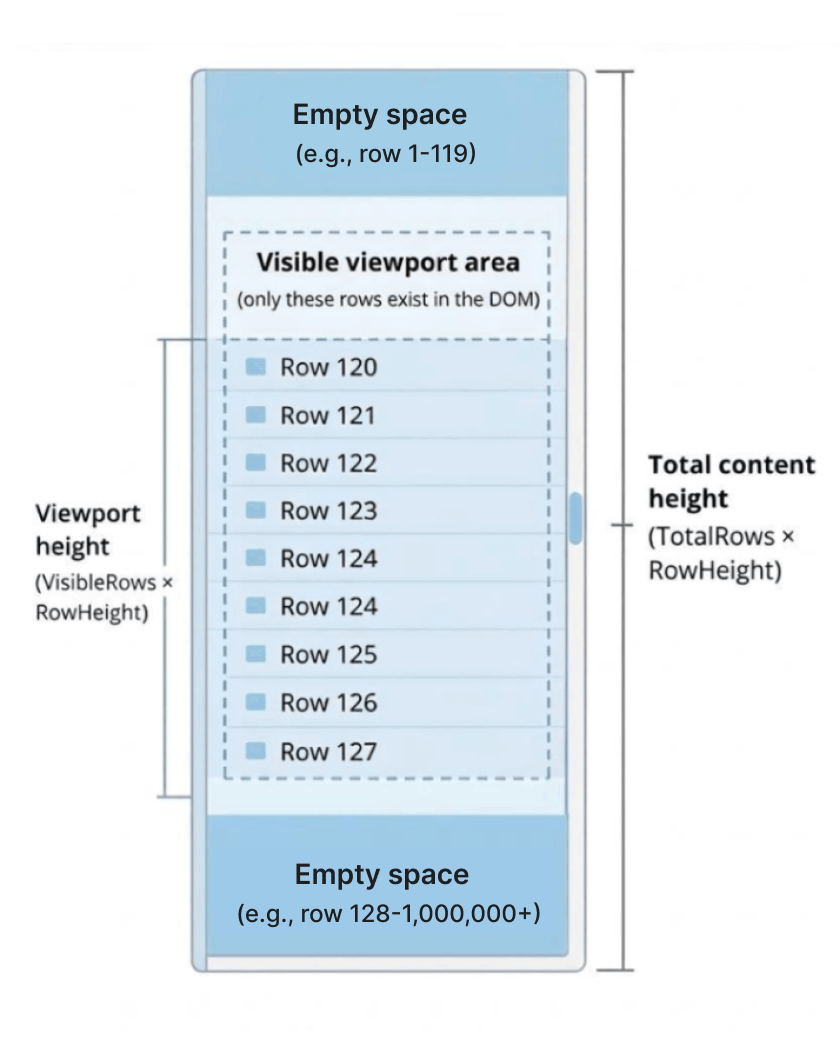
Performance benchmarking and validation
Provides React Pivot Table benchmark scenarios, testing environment, and benchmark results as a transparent reference for capacity planning and acceptance thresholds.
Benchmark scenarios
The benchmark covers the analytical actions most likely to affect report responsiveness — initial load, sorting, filtering, grouping, drill up and drill down, and DOM element count. Reproduce the real dataset, browser, and hardware before setting acceptance thresholds.
| Benchmark scenario | What the benchmark measures | Architectural relevance |
|---|---|---|
| Initial Pivot Table load | The time required to render the dataset and complete the first Pivot Table paint. | It establishes baseline page-load impact when the PivotTable is first introduced. |
| Sorting | The time taken to apply column sorting and return the dataset to its original order. | It demonstrates responsiveness during common data ordering operations. |
| Filtering | The processing time when applying and removing filter conditions. | It reflects the cost of iterative data narrowing during user workflows. |
| Drill up/Drill down | The time taken to resolve hierarchy levels, compute visible aggregates, and render Pivot Table updates. | It ensures drill down and drill up work smoothly by processing only necessary data and keeping the UI responsive during hierarchical exploration. |
| Grouping | The time required to reorganize data into grouped views, recalculate aggregates, and restore the original structure. | It demonstrates the system's ability to efficiently restructure and aggregate data for grouped analytical views while preserving responsive performance. |
| DOM element count | The number of DOM nodes rendered while displaying the dataset. | It helps evaluate rendering efficiency and browser memory impact. |
Testing environment
- Component: Syncfusion React Pivot Table 2026 Volume 1, version 33.1.44.
- Framework: React (production build).
- Browser: Google Chrome 122.x (Blink rendering engine).
- Operating system: Windows 11, (64 bit).
- Hardware: 13th Gen Intel(R) Core(TM) i5-13420H (2.10 GHz), 16 GB RAM.
- Method: Action lifecycle events measured operation start through completion of the UI update.
Watch out for Results vary with hardware, browser, viewport, dataset shape, report hierarchy, value fields, and enabled features.
Benchmark results
Syncfusion publishes indicative performance benchmarks that measure the time to render the visible portion of the Pivot Table after each operation completes. The results use a 100,000-row by 12-column dataset and average three runs. Treat them as reference evidence, not a production guarantee.
| Operation | Paging (ms) | Virtual scrolling (ms) | DataCompression (ms) |
|---|---|---|---|
| Initial load | ~1000 | ~786 | ~600 |
| Sorting (Row) | ~146 | ~157 | ~160 |
| Sorting (Column) | ~160 | ~160 | ~150 |
| Filtering (Row) | ~295 | ~357 | ~240 |
| Filtering (Column) | ~260 | ~291 | ~326 |
| Clear filtering (Row) | ~416 | ~475 | ~662 |
| Clear filtering (Column) | ~370 | ~466 | ~597 |
| Drill up | ~170 | ~158 | ~157 |
| Drill down | ~110 | ~160 | ~163 |
| Grouping | ~727 | ~810 | ~1117 |
| UnGrouping | ~490 | ~490 | ~555 |
Try live demo and navigate to the Performance tab to view and validate live performance metrics.
Real-time performance and scalability
Scales React Pivot Table real-time updates and analytic depth beyond raw row count, supporting fast live analytics across large datasets, deep hierarchies, and concurrent instances.
Real-time update performance
The Pivot Table supports controlled real-time data updates through batch editing and live data refresh. Updates recalculate affected summaries rather than treating the Pivot Table as a continuously edited cell grid.
| Real-time scenario | Syncfusion React PivotTable coverage | Rendering behavior |
|---|---|---|
| Batch updates | Batch updates are supported with documented integration guidance. | Data changes are collected and committed together; only impacted aggregates and pivot regions are recalculated, while unaffected areas remain unchanged. |
| Live data refresh | Live data refresh is supported with documented integration guidance. | Incoming data updates trigger selective pivot recomputation, updating relevant summaries while minimizing full Pivot Table re-rendering. |
Scalability beyond row count
Scalability extends beyond raw row count to row and column hierarchies, value dimensions, concurrent Pivot Table instances, and dynamic pivot configurations. As the number of aggregated cells grows exponentially, only the visible portion of the pivot matrix is rendered in the DOM, with the remaining rows, columns, and values rendered on demand during scroll or expansion. Evaluate the size of the pivot result, not only the raw row count. Row members, column members, values, and expanded hierarchies determine the visible matrix.
| Scalability dimension | Syncfusion React PivotTable coverage | Architectural behavior |
|---|---|---|
| Large row and column datasets | Virtual scrolling across both row and column axes. | Rendering is limited to visible cells within the viewport, regardless of total pivot size. |
| Concurrent Pivot Table instances | Multiple Pivot Table instances are supported on the same page. | Each Pivot Table maintains an independent rendering lifecycle. |
| Multiple-Pivot Table dashboards | Multiple Pivot Tables are supported in dashboard layouts. | Each Pivot Table virtualizes its own dataset and rendering pipeline. |
| Grouping with large datasets | The component supports grouping large Pivot Table datasets with expand and collapse functionality. | Grouped rows and columns are loaded and rendered only when expanded. |
| Aggregation across large datasets | Both client and server-side aggregation is supported. | Aggregates can be computed against the complete dataset in the back end. |
For mobile and tablet use, test the actual viewport, touch interactions, field list, and report width.
4
Security and compliance
A fully client-side analysis and visualization component that runs entirely in the browser, the Pivot Table performs all pivot operations locally using secure browser APIs, without relying on vendor-managed runtimes or cloud services. Security, compliance, and data governance remain the responsibility of the application and back-end infrastructure.
Security architecture and responsibilities
Outlines the security responsibility matrix, the client-side security overview, and the OWASP alignment, so the React Pivot Table provides a self-contained, CSP-friendly foundation while leaving RBAC, masking, and audit to the application.
Security responsibility matrix
The following matrix outlines the safeguards provided by the Pivot Table component and the safeguards the hosting application must enforce. The Pivot Table is an analytical UI component, not an identity, access-control, or data-governance service.
| Security area | Component behavior | Application responsibility |
|---|---|---|
| Authentication | Does not authenticate users; simply analyzes and visualizes the data provided. | Execute user authentication and secure API endpoints delivering pivot data. |
| Authorization | No role or permission enforcement; renders and pivots any dataset it receives. | Apply RBAC or permission checks and return only authorized datasets for analysis. |
| Data validation | Does not validate data type correctness or business-rule conformance. | Validate data ranges, formats, field integrity, and metric semantics on the server. |
| Input sanitization/XSS | Renders provided text as supplied; applications should sanitize untrusted content before binding. | Ensure all field labels, member captions, and custom text are sanitized or encoded before use. |
| Data aggregation and transformation | Performs client-side pivot aggregations only; does not compute or verify business metrics. | Perform secure back-end data preparation, apply business rules, and validate analytics results. |
| CRUD operations | No create, update, or delete operations; pivot interactions are read-only by default. | Secure any drill-through API calls, validate query parameters, and prevent unauthorized data access. |
| Interaction events | Triggers field-drag, filter, drill-down, and sort events but does not process or validate event payloads. | Handle drill-through requests securely, apply permission checks, and audit usage patterns. |
| Transport security | No control over network transport or headers. | Enable HTTPS, secure CORS and protect tokens or analytics query parameters. |
| Data masking or sensitivity handling | Displays raw values received. | Mask or anonymize sensitive metrics before sending them to a UI; protect multitenant data separation. |
| Audit logging | Does not log any data interactions or user behavior. | Record user interactions with pivot data as part of standard, application-level auditing. |
| RBAC and multitenancy | No awareness of tenant boundaries or roles. | Enforce strict tenant isolation and only provide datasets scoped to the authenticated user. |
| Export and print controls | Supports exporting pivot reports to Excel, PDF, or CSV format, but does not apply export restrictions or masking. | Manage export permissions, mask sensitive fields in exports, and restrict unauthorized downloads. |
| Client-side rendering security | Pure DOM rendering; no server execution or file writes. | Ensure field captions or custom templates are safe, validate injected HTML, and enable secure headers. |
| Performance and rate limiting | Renders whatever datasets are passed; does not limit data volume. | Enforce API rate limits and impose dataset size restrictions to avoid overload or data leakage. |
| Third-party integration security | Does not integrate external scripts unless the application injects them. | Ensure no unsafe script injection and validate any external data sources before binding. |
| Data lifecycle and storage | Does not store data or cache it beyond browser memory. | Avoid sending long-lived sensitive analytics data and clear cached responses where necessary. |
Security architecture overview
The Pivot Table does not interact with back-end systems, initiate fetch calls, or open WebSockets. All rendering, pivot aggregation, sorting, filtering, and drill-down logic executes on the client using in-memory data supplied by the application. The Pivot Table receives authorized data or summarized results, builds the analytical view, and emits user interactions to application logic.
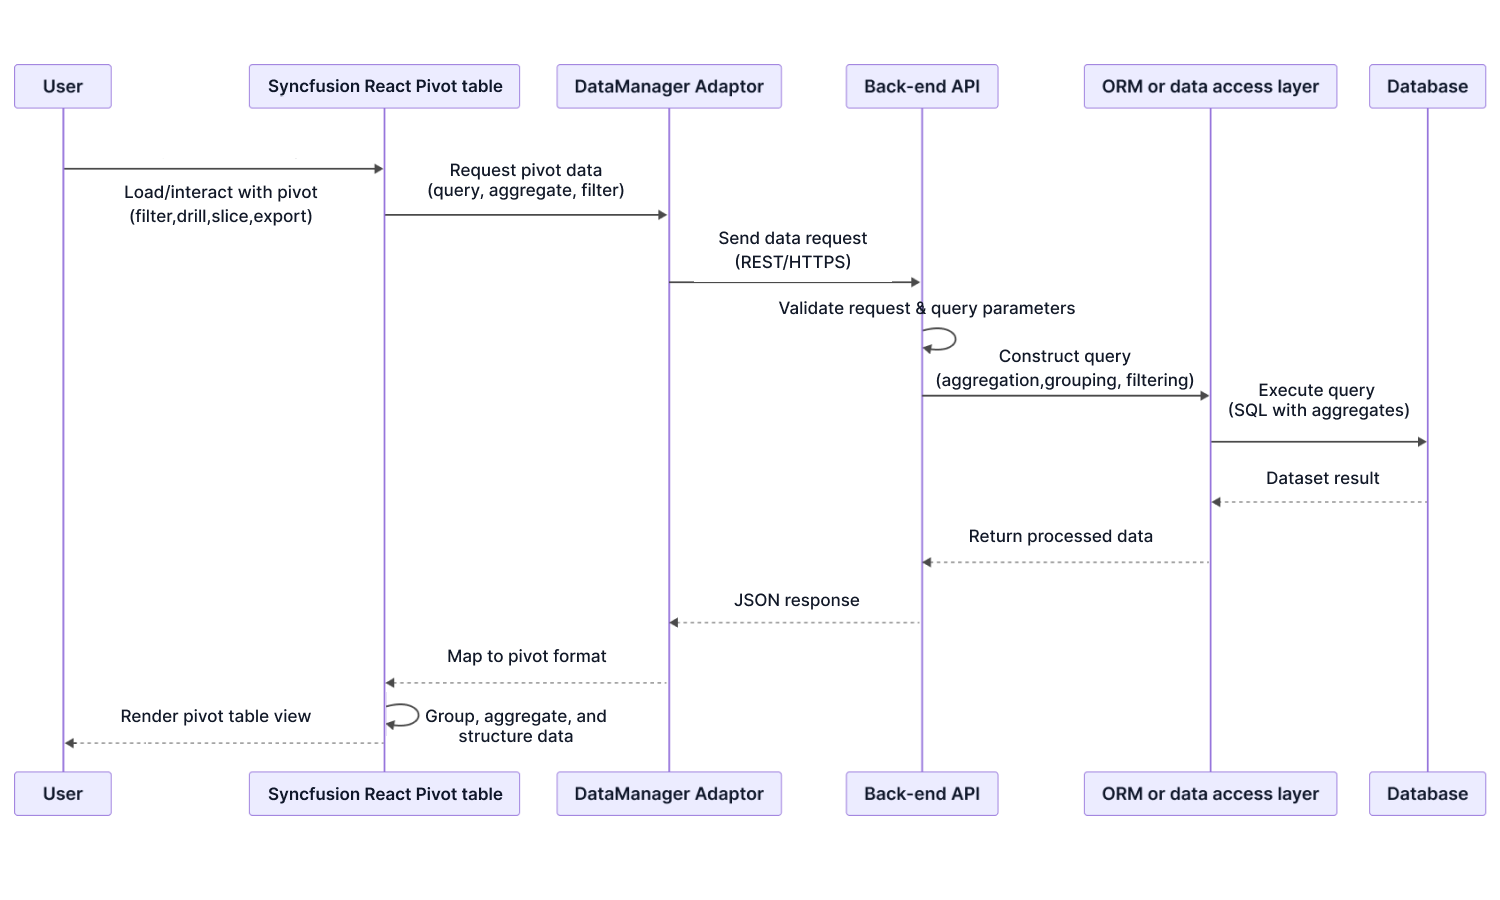
OWASP security responsibility context
The Pivot Table aligns with the OWASP security risk areas that apply to a client-side data analysis and visualization component.
| OWASP risk area | How it relates to the Pivot Table | Responsibility |
|---|---|---|
| A01: Broken Access Control | The Pivot Table renders any dataset passed to it and has no mechanism to enforce row-level, field-level, or tenant-level filtering. | The back end must enforce access rules, restrict dataset visibility, and return only authorized analytics data. |
| A03: Software Supply Chain Failures | The Pivot Table npm package depends on third-party components, which can introduce risks if compromised or outdated. | Organizations must monitor dependencies, verify trusted sources, and promptly update and patch vulnerabilities. |
| A04: Cryptographic Failures | The Pivot Table relies on the application's API transport layer; no encryption or decryption occurs inside the component. | Application and infrastructure must enforce HTTPS/TLS and protect sensitive analytic payloads. |
| A05: Injection | Field captions, member names, calculated field expressions, and custom templates may display user-supplied text. The Pivot Table does not sanitize these fields automatically. | The application must sanitize or encode all field labels, member names, caption text, and custom cell template data before binding. |
| A07: Authentication Failures | The Pivot Table does not handle authentication tokens, sessions, or identity checks. It simply analyzes and visualizes the provided data. | Authentication must be implemented by the application and identity provider. |
| A08: Software or Data Integrity Failures | As an npm package, integrity depends on trusted package sources, lock files, and controlled distribution. | Use internal registries, restricted CI/CD pipelines, and checksum verification. |
| A09: Security Logging and Alerting Failures | Use internal registries, restricted CI/CD pipelines, and checksum verification. | Applications must capture and log data fetches, drill-down events, field changes, and unusual access patterns. |
Application and data security
Keeps the network path clean and app-controlled for the React Pivot Table, with data flow, authentication, authorization, deployment security, and export security all owned by the application.
Data flow and network behavior
In local-data mode, the Pivot Table works only with in-memory data supplied by the application. It does not load data, make API calls, initiate fetch calls, open WebSockets, or send background requests. DataManager, OLAP, and server-engine configurations use application-defined endpoints; no Syncfusion -controlled network path is introduced.
- The application decides which endpoint is called, which data is returned, and which API routes and request flows are used.
- The networking layer attaches credentials, tokens, and headers.
- The back end enforces field, record, role, and tenant restrictions.
- WAF, API gateway, reverse proxy, and monitoring controls remain outside the component.
Authentication and authorization integration
The Pivot Table does not handle authentication, authorization, session control, or data governance. Permissions are expressed through the fields, records, report options, and events supplied by the application.
| Security requirement | Pivot Table capability | Security enforcement layer |
|---|---|---|
| Dataset visibility/field access | Renders exactly the dataset provided; has no built-in filtering or role checks. | Back-end layer: Return only fields and data members allowed for the authenticated user. Application layer: Bind only permitted datasets to the Pivot Table. |
| Field-level access control | Shows all fields passed into its field list configuration; no awareness of user roles. | Back-end or application layer: Remove restricted fields before passing to the Pivot Table. |
| Drill-down and drillthrough permissions | Supports drill-down and drillthrough events but does not enforce who may perform them. | Application layer: Validate drillthrough parameters and enforce role permissions. Prevent unauthorized drillthrough calls on the back-end level. |
| Data filtering based on role or tenant | Does not independently filter or fetch data; only analyzes and renders what it receives. | Back-end layer: Apply strict tenant isolation and role-based filtering for analytics. Application layer: Bind only the subset of data authorized for the user. |
| Sensitive data masking | Displays numeric or textual values exactly as provided. | Back-end or application layer: Mask or encrypt sensitive fields before sending them to the UI. |
| Read-only analysis mode | Always read-only by default; pivot operations do not modify server data. | Application layer: Ensure drillthrough endpoints or metric APIs are read-only unless exceptions exist. |
| Export access control | Supports exporting pivot reports to Excel, PDF, or CSV format, but does not enforce export permissions. | Application or back-end layer: Restrict export ability by user role; mask sensitive data before export; log export events if required. |
| Field caption and member content | Renders field captions, member names, and summary labels without permission checks. | Application layer: Ensure only nonsensitive, authorized caption content is provided; sanitize user-supplied text. |
| Validation of user interactions | Emits callbacks on field drag, filter, sort, drill-down, and calculated field changes, but performs no access validation. | Application layer: Validate and authorize any drillthrough or filtered API call triggered by interaction. |
| Audit logging of analytics access | Emits interaction events that apps can hook into. | Application layer to logging or SIEM: Log dataset requests, drill-down calls, field-list changes, access to specific KPIs, and suspicious analytics usage. |
| Multitenant and role-based metric control | No awareness of tenant boundaries, user groups, or role segregation. | Back-end layer: Enforce strict tenant scoping for datasets. Application layer: Bind only authorized slices of analytic data. |
Deployment security characteristics
The Pivot Table is a self-contained client-side component with no external runtime dependencies, no dynamic code execution, and no outbound network requests. Review the deployment properties against the organization’s runtime and network policies.
| Deployment characteristic | What it means |
|---|---|
| No external runtime connections by default | The Pivot Table component never contacts Syncfusion servers or third-party services. It only analyzes and renders the datasets your application provides. |
| All assets bundled within the npm package | All script, style, pivot engine, and internal utilities come from the npm package; no external CDN or asset host is required. |
| Functions without internet connection | Operates fully offline because it does not load remote resources or initiate outbound network requests, making it suitable for secure, isolated, or restricted environments. |
| Internal registry compatible | Pivot Table assets are fully static with no inline CSS or runtime-loaded scripts, allowing use in internal registries, enterprise mirrors, and offline deployments. |
| Safe for strict content security policies (CSP) | The Pivot Table uses standard React rendering and static assets with no eval, no dynamic HTML injection, and no prohibited runtime constructs. |
| Client-side pivot aggregation | Aggregation, grouping, calculated fields, and filtering run entirely in the browser with no server involvement. |
| Independent field list and pivot view generation | All pivot views, field list panels, and chart integrations are rendered locally without external engines. |
| Local interaction handling | Interactions such as field drag-and-drop, filter dialog, and drill-down are processed fully in the browser, requiring no API calls unless you choose to make them. |
| Print-ready client rendering | Pivot Table exporting and printing relies entirely on browser capabilities; no server-side rendering or export engines are required. |
Export security
Export behavior is controlled by the host application. The Pivot Table only exports the data it is given. Export reflects the report and data supplied by the application. Authorization and masking must be applied before output generation.
| Export security concern | How it is addressed | Enforcement location |
|---|---|---|
| Export access control | Export triggers can be enabled or disabled based on user roles; no built-in RBAC enforcement. | Application layer |
| Export data scope | Export output reflects exactly the dataset and pivot state provided, with no internal filtering or restriction. | Application layer |
| Data sensitivity protection | Sensitive fields must be masked or sanitized before binding to prevent exposure in exports. | Back-end or application layer |
| Drill-through data | Drill-down exports must respect role-based access; unauthorized datasets should be blocked. | Application to back-end authorization |
| Multitenant isolation | Cross-tenant data must be prevented at the data source level; no tenant awareness within the component. | Back-end layer |
| Export auditing | Export actions can be intercepted and logged for compliance and monitoring purposes. | Application to audit/logging system |
| Server-side export control | If server-side export is used, all data flows through controlled endpoints that enforce authorization. | Back-end export service |
| Export destination | Exports are generated locally in the browser or through the application's back end; no reliance on external services. | Component architecture |
| Metadata exposure | Field captions, member names, and labels appear exactly as provided; sanitize if sensitive. | Application layer |
| Filter and configuration integrity | Exports reflect current filters and pivot configuration; applications should ensure applied filters are authorized. | Application to back-end validation |
Compliance and security assurance
Provides React Pivot Table compliance certifications, vulnerability management, and security assurance statements as verifiable evidence for procurement and security review.
Compliance certifications
Syncfusion maintains independently audited security and privacy compliance frameworks that support enterprise procurement. Use current procurement evidence rather than treating organizational certifications as certification of an individual UI component.
| Certification or standard | Syncfusion coverage | Procurement reference |
|---|---|---|
| SOC 2® Type 2 | Syncfusion maintains independently audited SOC 2® Type 2 controls for its development and operational practices. | SOC 2® Type 2 overview |
| GDPR | Syncfusion documents GDPR-aligned data processing practices suitable for privacy and compliance reviews. | GDPR overview |
| WCAG 2.1 AA (accessibility) | Syncfusion components are tested for WCAG 2.1 AA conformance. Official accessibility documentation is published. | Accessibility standards |
| ISO 27001 | Syncfusion aligns with ISO 27001 information security management practices; certification status and documentation are provided by Syncfusion upon request. | Contact sales team for certification details. |
| Section 508 | Syncfusion aligns with Section 508 accessibility requirements, supported by WCAG conformance testing and published accessibility documentation. | Section 508 documentation |
Vulnerability management
Syncfusion maintains a formal vulnerability management process for all components, including for the Pivot Table. Review how reported issues and dependency updates are communicated and delivered.
| Vulnerability management aspect | Syncfusion coverage | Where to verify |
|---|---|---|
| Responsible disclosure policy | Syncfusion maintains a public responsible disclosure program for reporting vulnerabilities for all libraries, including for the Pivot Table. | Responsible disclosure |
| Security patch delivery | Security patches for the Pivot Table and other UI components are delivered through routine Essential Studio or npm package updates. | Release notes |
| Security fix documentation | Release notes document resolved vulnerabilities, dependency updates, and security-relevant corrections for all components, including the Pivot Table. | Release history |
| Enterprise security escalation | Enterprise customers can escalate security issues through dedicated priority support channels for rapid triage. | Support SLA |
| Dependency vulnerability monitoring | Syncfusion monitors vulnerabilities in third-party libraries and updates dependencies as part of its secure development and maintenance process. | Release notes |
The source also references guidance on regulatory compliance.
Security assurance statements
Each security assurance statement includes a verification method for the Pivot Table component or Syncfusion vendor practices. Treat each assurance statement as a claim to verify in the production build.
| Assurance statement | Verification method |
|---|---|
| The Pivot Table component does not initiate outbound calls to Syncfusion or third-party services. | Can be verified through browser developer tools and network inspection to confirm no unexpected external requests. |
| The component does not rely on inline style injection for standard rendering scenarios. | Inspect Elements panel and CSP logs to ensure no inline styles are injected. |
| No eval, function constructor, or dynamic script generation is used. | Review CSP policies and monitor browser console for unsafe-eval or script execution warnings. |
| Field value and member caption rendering prevents script execution. | Test with sanitized and unsanitized payloads to validate application-level protections. |
| The component does not store or process authentication tokens or session identifiers. | Verify no storage or cookies are created by the Pivot Table component. |
| Syncfusion security documentation (SOC 2® Type 2, GDPR, Section 508, WCAG) is available for review. | Request verification via Syncfusion enterprise support or the sales team. |
| Accessibility conformance (WCAG 2.1 AA) is documented and published for the Pivot Table component. | Accessibility documentation |
| Security patches, dependency updates, and vulnerability fixes are provided as part of regular releases. | Release history and Release notes |
| The component does not independently store analytics data in browser storage. | Check application storage for unexpected entries. |
| Pivot Table interactions do not independently trigger external requests. | Monitor runtime behavior through network inspection during interactions. |
| Drill-down callbacks do not perform automatic fetches; the application controls all network actions. | Inspect callback handlers and verify no network calls during drill-down. |
| Aggregation, grouping, and pivot calculations are performed locally. | Confirm that aggregation or field calculation generates no network requests. |
| Rendering runs fully in the browser with no external dependency. | Verify that loaded assets in the network are only from local bundles. |
| Exporting pivot reports does not send pivot data externally. | Monitor network behavior during exporting and printing. |
| No external analytics or pivot libraries are dynamically pulled at runtime. | Ensure all scripts or styles load solely from the local application. |
| Animations and layout computations are handled locally without reliance on external processing services. | Observe runtime behavior and confirm absence of external requests. |
| The component does not independently transmit telemetry or analytics data. | Monitor DevTools network tab for hidden POST calls. |
5
Interactive live demos
Use the interactive live demos to assess the component in representative usage scenarios. Explore key capabilities, interactions, configuration options, and runtime behavior to validate functional fit and user experience against application requirements.
Try our Live Demo
6
Evaluation checklist
Print or copy this checklist into the evaluation record. Each item maps to a capability, limitation, responsibility boundary, or verification method documented above.
01. Runtime compatibility
- Target framework and deployment environment are covered by the compatibility matrix
- The installed Syncfusion version meets the minimum requirement for the application React version
- Next.js client boundaries, Suspense, ISR, and Edge behavior are tested where applicable
- Required browsers and any legacy polyfill conditions are accepted.
02. Build and application architecture
- The production build succeeds with the target bundler, TypeScript settings, CSS strategy, and imported modules
- The required ESM, CommonJS, or UMD format fits production and test tooling
- Application state remains the source of truth for data and report configuration
- The design system can be reproduced with built-in themes, CSS variables, SCSS, or Theme Studio
- Unit, interaction, end-to-end, and visual tests run in the existing CI/CD pipeline
- Micro-front-end dependency sharing prevents duplicate Pivot Table versions.
03. Integration and extensibility
- The chosen adaptor matches the production API contract
- Relational, OLAP, or server-engine processing is selected intentionally
- Raw-data exposure to the browser is acceptable for the selected processing model
- JWT, OAuth, token refresh, mTLS, and 401/403 responsibilities are correctly divided
- Required cell, tooltip, toolbar, loading, formatting, and hyperlink extensions use documented APIs
- Events and methods cover report changes, drilling, persistence, export, auditing, and accessibility
- Upgrade, deprecation, and migration policies meet the maintenance plan.
04. Performance and scalability
- Virtual scrolling, single-page mode, paging, and data compression are selected for the real workload
- Client, OLAP, or server-side aggregation is tested with production-shaped data
- Initial load, sorting, filtering, grouping, drilling, and refresh are measured on target hardware
- DOM size, memory, scrolling, and long-session behavior are inspected with DevTools
- Wide reports, deep hierarchies, multiple instances, and mobile layouts meet requirements
- Large export behavior is tested in the selected client or server mode
- Published benchmark results are used only as reference points.
05. Security and compliance
- Authentication, authorization, field access, record access, masking, and tenant isolation owners are assigned
- Network inspection confirms that only application-configured endpoints are used
- Untrusted captions, member values, formulas, hyperlinks, and templates are sanitized
- Strict CSP behavior is tested with the exact production feature set
- Drillthrough and export permissions are enforced and audited
- Current SOC 2, GDPR, accessibility, Section 508, ISO-status, and support evidence has been obtained
- Dependency provenance, version pinning, vulnerability monitoring, and patch review are owned.
06. Final decision
- Every mandatory criterion passes or has an accepted condition, owner, mitigation, and review date
- No limitation conflicts with a non-negotiable architecture, security, accessibility, or deployment requirement
- Test evidence, benchmark results, package versions, logs, and procurement documents are stored
- Development, architecture, security, data, and procurement stakeholders approve the selected configuration.
7
Frequently asked questions
Review the questions that most often affect architecture fit, analytical scale, security approval, and long-term adoption.
Can the React Pivot Table work while an application migrates from the Next.js Pages Router to the app router?
Yes. The React Pivot Table supports both the Pages Router and the App Router. Use the client-component boundary on App Router pages and test hydration, data loading, and CSS in both route types. See the Next.js guide.
When should an OLAP source be used in React Pivot Table?
Use OLAP when the organization already manages cube data and wants aggregation and hierarchy operations to remain in the cube engine. The React Pivot Table connects through the documented OLAP configuration.
When should the server-side pivot engine be used in React Pivot Table?
Use the server-side pivot engine of the React Pivot Table when raw data should not be loaded into browser memory or when aggregation and drill operations need back-end scale. The client sends report settings and receives summarized results. Review the server-side pivot engine documentation.
Does React Pivot Table’s virtualization apply to both rows and columns?
Yes. React Pivot Table’s Virtual scrolling limits rendering to the visible portion of both axes. Test the actual hierarchy depth, report width, values, and expanded members because these affect the visible matrix.
How should the published performance benchmarks be used in React Pivot Table?
Use the published performance benchmarks for the React Pivot Table to understand the measured scenario and build a repeatable internal test. Reproduce the real dataset, report definition, browser, hardware, and enabled features before setting performance targets.
Can the React Pivot Table handle real-time or frequently changing data?
Yes. The application updates the source and refreshes the React Pivot Table. Test the expected update rate because recalculation cost depends on report shape, aggregation, and the number of affected summaries. See the live data demo.
Does GraphQL require a completely custom implementation in React Pivot Table?
No. The React Pivot Table includes a built-in GraphQL adaptor, so a fully custom implementation is not required in most cases. Request and response mapping may still be required for the application schema, and a custom adaptor is appropriate only when the built-in contract is insufficient.
How should multiple micro-front-end teams avoid conflicting versions in React Pivot Table?
Declare the Syncfusion package for the React Pivot Table as a shared singleton in the shell. Teams can own their report configuration, while the shell resolves the loaded version.
Can React Pivot Table reports be saved and restored?
Yes. In the React Pivot Table’s report configuration, field layout, sorting, filters, and expanded state can be serialized to application-selected storage and restored later.
Can Excel export preserve a React Pivot Table structure?
Yes. React Pivot Table server-side exporting can generate native Excel Pivot Tables with filtering, grouping, and drill behavior. Validate the required output and endpoint implementation during the proof of concept.
Can the React Pivot Table run under a strict content security policy?
Yes. The React Pivot Table supports CSP-compatible rendering and performs no dynamic code evaluation. Test dynamically applied styles before deployment. Run the production build under the actual policy and inspect CSP logs.
Does the React Pivot Table send analytical data to Syncfusion services?
The React Pivot Table does not contact Syncfusion or third-party services. Remote data, OLAP, and server-engine traffic uses endpoints selected by the application.
How are security and compliance documents obtained in React Pivot Table?
Use the published SOC 2, GDPR, accessibility, responsible-disclosure, release-note, and support references for the React Pivot Table. Request restricted or current procurement documents through Syncfusion enterprise sales or support.
8
Resources
Use these references after the guide and FAQs to continue implementation, validation, security review, and procurement.
- React Pivot Table documentation- Start with installation and basic report configuration.
- Live interactive demo- Explore the Pivot Table in a browser.
- Knowledge base articles- Review task-specific implementation and troubleshooting guidance.
- Tutorial videos- Follow feature walkthroughs in video format.
- Feature walkthrough video- See a guided product overview.
- Pivot Table web story- Review a short visual introduction.
- Figma UI kits- Check available design assets.







