We use cookies to give you the best experience on our website. If you continue to browse, then you agree to our privacy policy and cookie policy.


The HTML5 JavaScript Report Designer is a jQuery based web reporting tool used to create and edit simple to complex RDL reports. The web-based report designer makes it easy to integrate an intuitive run-time RDL report editing and customization into your web application. It lets you create reports with reporting features such as parameters, expressions, sorting, grouping, filtering, report linking, hyperlink, and more. You can preview and export the report to PDF, Excel, CSV, WORD, PowerPoint, and HTML formats.
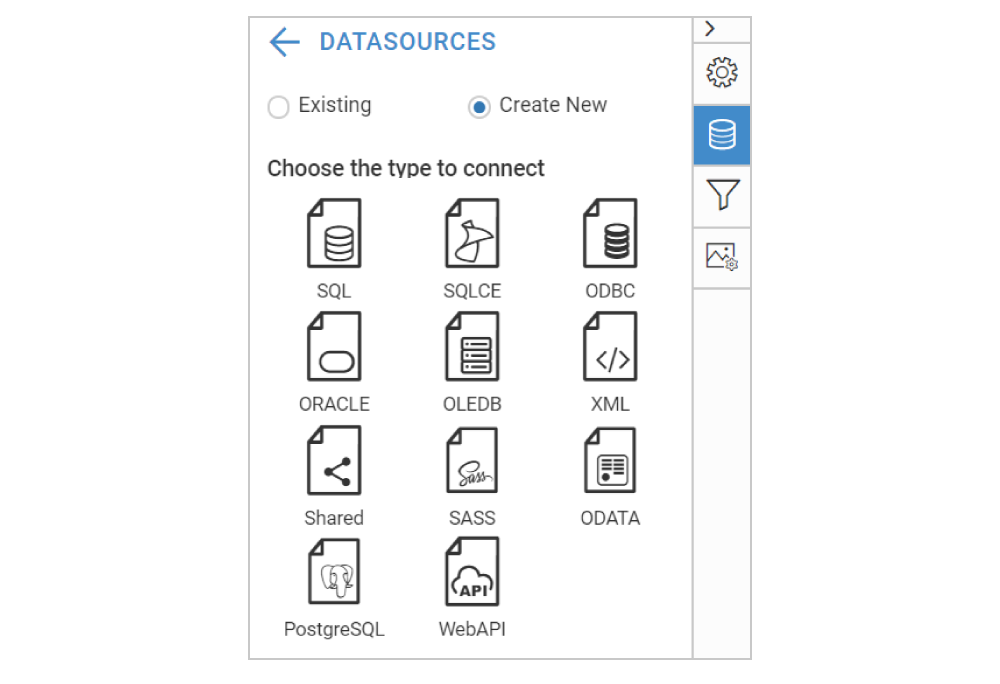
Explore your data from any of the local or server data bases. Create an embedded or shared data source by connecting to the most common data sources by using the following data providers.

Data query preparation can take most of your time, but with Report Designer, data query generation can be done with a few clicks. Query builder provides a convenient user interface that helps both technical and nontechnical users to create and view relationships between tables.
Enables users to create stylish and interactive reports using a rich set of data region, visualization, and basic report items efficiently:

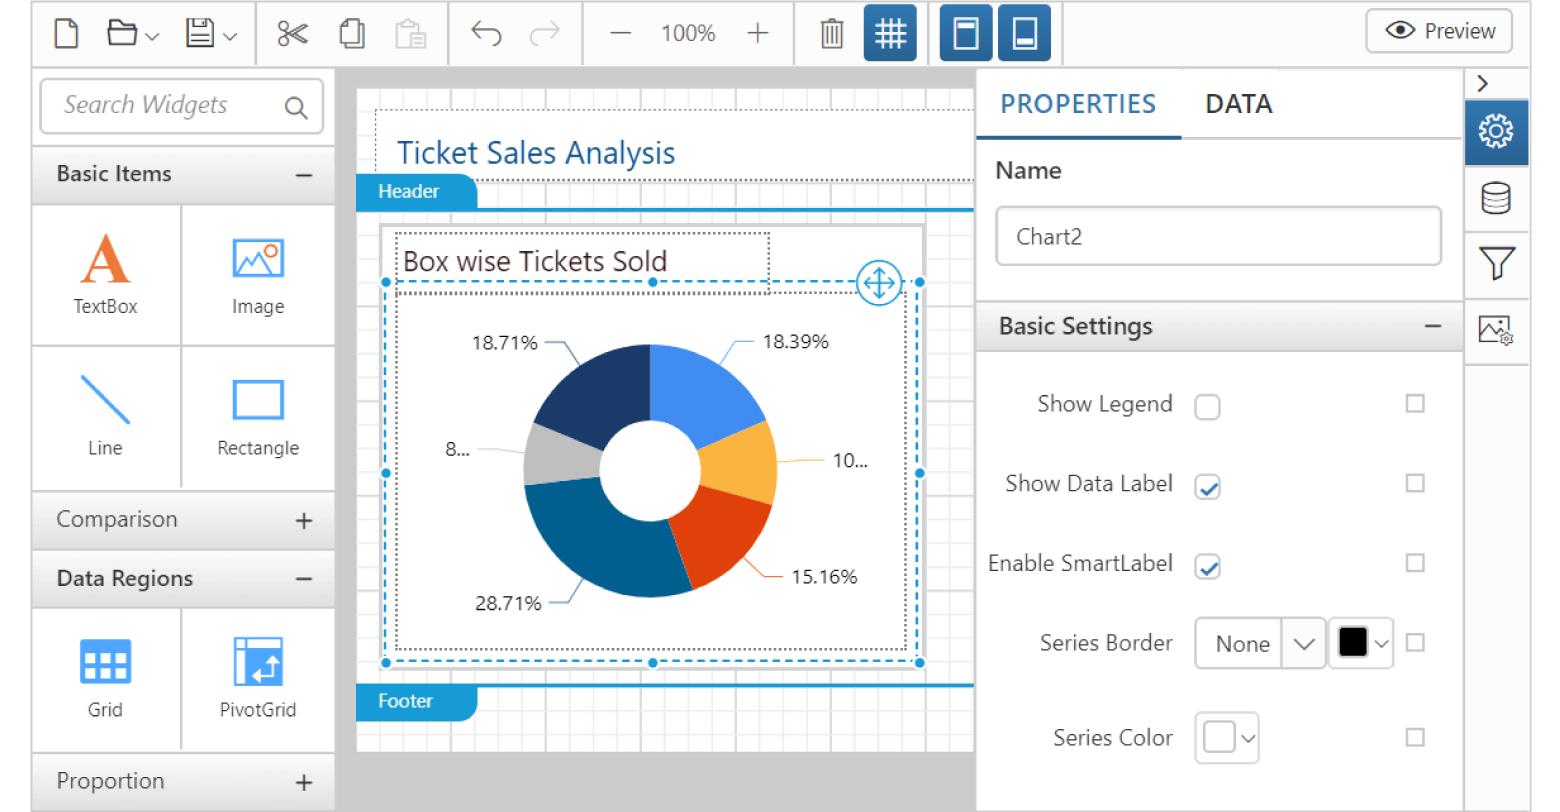
Provides rich user-friendly interface to easily transform your data into beautiful reports, using the configuration options such as property panel, data configuration panel and image manager.
Supports creating report parameters manually or based on a data set query. Parameters are used to interactively provide user inputs at run-time to vary report presentation based on it. Parameters can also be used in expressions to control report data.

Allows creating an embedded or a shared dataset with parameter to filter or limit data. A data set can contain user-defined parameters for internal calculations or report parameter to get run-time inputs from users.

Users can add cascading parameters to the report to allow one parameter that limits the values for the next parameter. It greatly reduces the number of choices to a manageable number.
JavaScript Report Designer support to add filtering, grouping and sorting for data region items such as grids, pivot grids and for data sets. It organizes the data values of the data region report items.
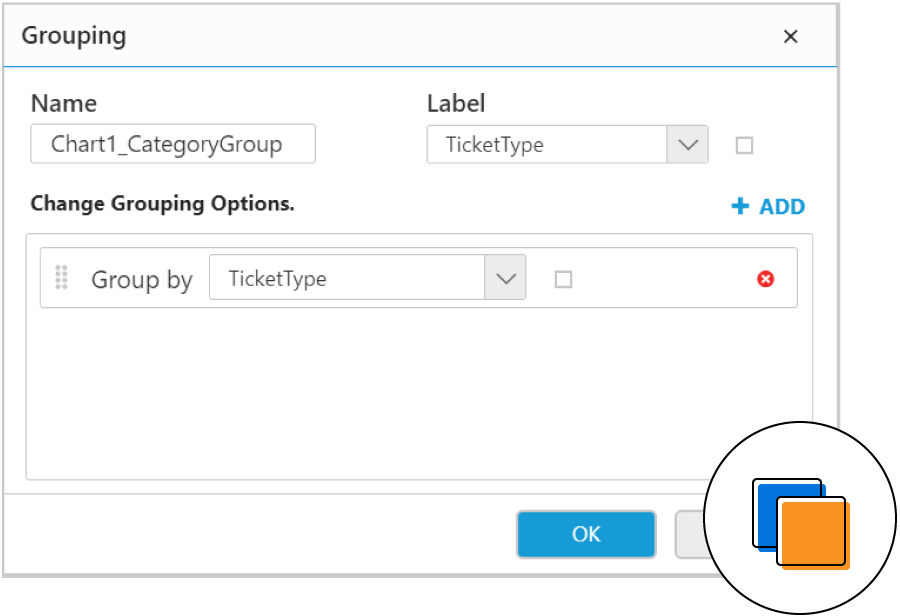
User can add grouping to display data in a hierarchy view by organizing nested, adjacent, and recursive hierarchy groups. You can use a dataset field, expression or other values to group data.

Supports adding sort expressions to chart category and series groups and pivot table groups. It controls the order in which data is displayed in a data region item of the report (either as ascending or descending).

Provides support to add filters to an embedded data set or shared data set, data regions, and data region groups, including detail groups. The filter equation includes a dataset field or expression, an operator, and a value used to compare.
Allows users to create a report with SQL RDL reporting’s extremely powerful interactive features like drill through and hyperlink to display data and information in detail.

An action property is available to specify the drill through report path. It allows end users to click on a data value in the report to view related data information in the child report. A separate child report can have detail/summary data. Also, users can add parameters to filter data based on user selection.

Provides property options to set hyperlink actions to text boxes, images, charts, and gauges. The hyperlink can contain data field, static or dynamic URL value expression.
Report Designer provides an expression builder that allows you to create simple and complex RDL expressions. Expressions are used throughout the report definition to vary the content or appearance of a report. The following are some usages of expression.

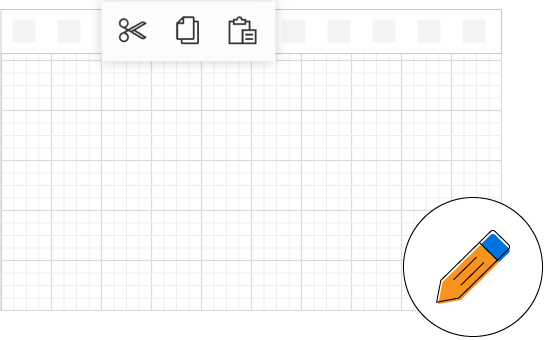
Editing a report and its report items is simple with the support of basic editing operations such as cut, copy, paste, undo, and redo.
The HTML5 JavaScript Report Designer provides an option to preview the report and verify whether the created report displays what you require. The reports are displayed using JavaScript Report Viewer with all the RDL functionalities.


Run or preview a report, and export it to popular file formats such as PDF, Word, Excel, CSV, PowerPoint, and HTML.

Supports printing previewed reports by clicking the print option from the JavaScript Report Viewer toolbar.

Clicking print layout option on the JavaScript Report Viewer toolbar shows the report in a printable output format.

Users can open and edit any report that is already created using SQL RDL specification. The edited report can be previewed and saved to the same location or to a different location.
The HTML5 JavaScript Report Designer allows you to save a report to Syncfusion Report Server or SSRS Report Server and to your computer. Publishing a report to the server allows other users (who have permission to access the server) to view it.


You have control over all the UI elements and behaviors of the HTML5 JavaScript Report Designer. You can provide the best experience to your end users through a rich set of developer-friendly APIs.

The HTML5 JavaScript Report Designer supports jQuery, Angular, and React. This allows you to create your own application with web reporting features.

You can format the report contents to any language that helps your users from different locales.

Users can localize all static text of the HTML5 JavaScript Report Designer to any preferred language.

The HTML5 JavaScript Report Designer will adaptively render itself with optimal user interfaces for phone, tablet, or desktop form factors. This helps your application to scale elegantly on all form factors with ease.

Works in all modern browsers on all devices as the JavaScript Report Designer is rendered using HTML5 elements.

The HTML5 JavaScript Report Designer is shipped with themes such as material, bootstrap, fabric (office 365), high contrast, and more. Users can create new themes to have their own desired look and feel by using the Theme Studio application with ease.

 Documentation
Greatness—it’s one thing to say you have it, but it means more when others recognize it. Syncfusion is proud to hold the following industry awards.


