
jQuery Maps Control : Interactive & Powerful Rendering Maps Widget
- Ideal for rendering maps from various map providers including OpenStreetMap and Bing maps.
- Customize the maps by rendering GeoJSON data and by adding features like bubbles, markers, legend, and more.
- Simulate the concepts like bus seat selection, cricket stadium, and more by rendering your own custom shapes.
Trusted by the world’s leading companies

Overview
jQuery Maps control is a powerful data visualization widget that can be used to articulate data as a map. It is frequently used in financial dashboards for plotting sales across geography.

GeoJSON
Use the GeoJSON format shapes to render any geometric shapes for powerful shape data visualization.
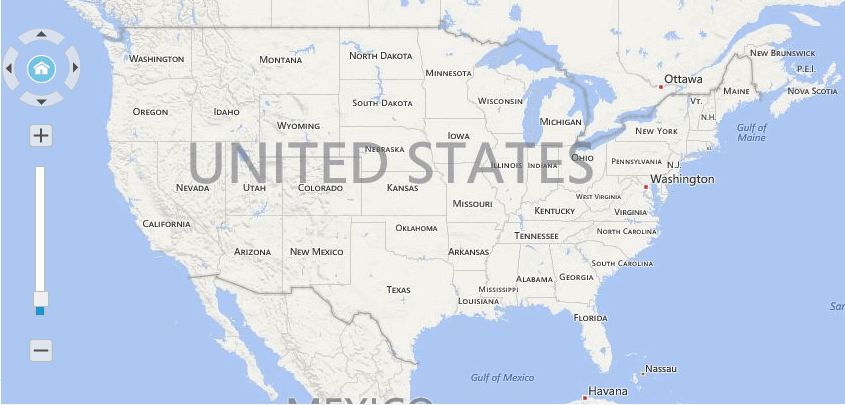
Interactive Zooming and Panning
Zoom and pan the map with the mouse for close-up analysis for easy navigation across its regions.
Multilayers
Visualize multiple layers in one view. Easily drill into each layer as desired.
Geo-Imagery Visuals
Built-in support for external geospatial imagery services, including Bing® Maps and © OpenStreetMap to visualize satellite, aerial, street map, or other kinds of imagery tiles without any external shape inputs. Using this external services, locating map data is made easy.
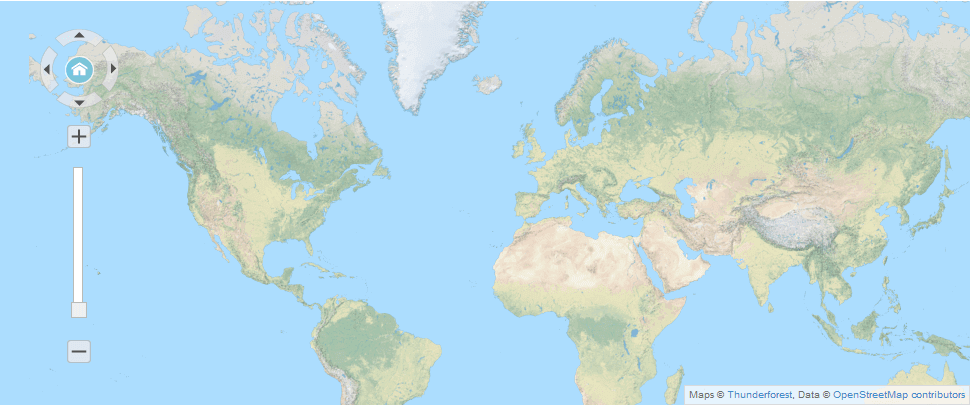
OpenStreetMap
Access external geospatial imagery services like OpenStreetMap for deep zoom satellite view.
Bing Map
Access external geospatial imagery services like BingMap for deep zoom satellite view.
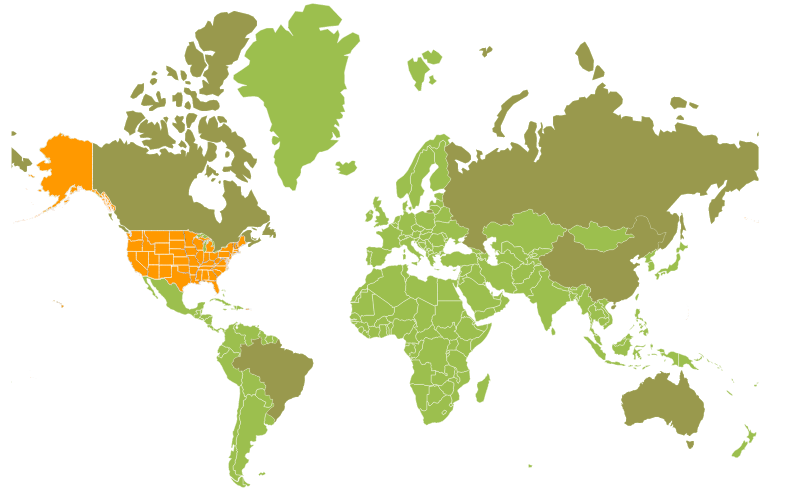
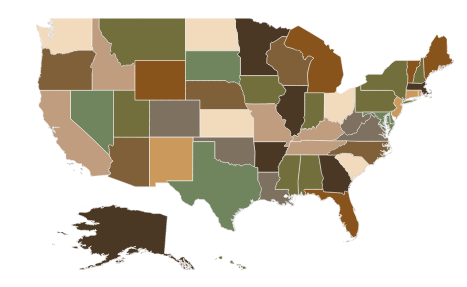
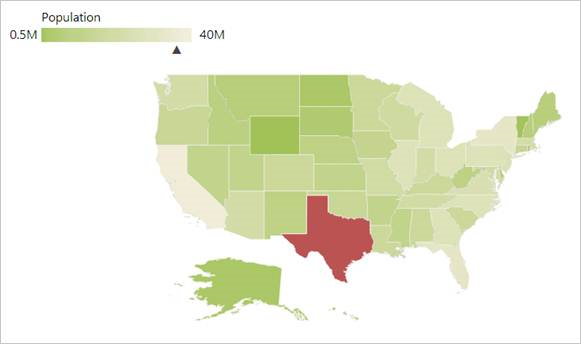
Heat Map
Provides values to fill colors within regions on a map to generate a simple, yet powerful visualization for any set of business data in more comprehensive way.
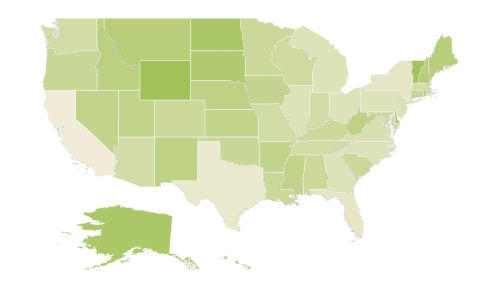
Palettes
Access built-in palettes with customizable options to fill various ranges of colors by default.
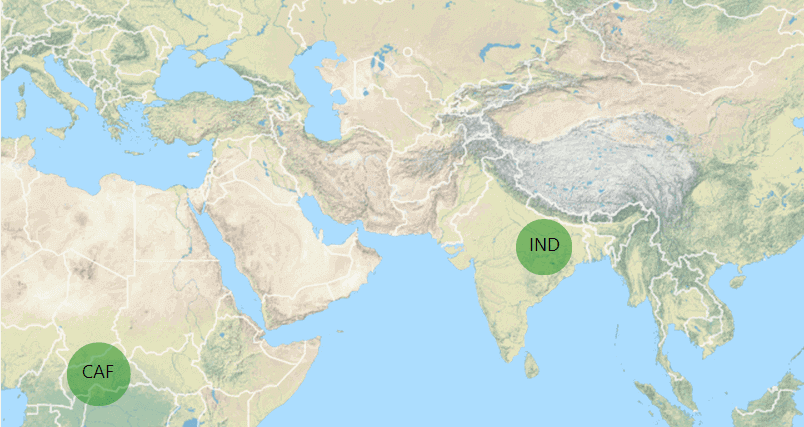
Bubbles
Design map element bubbles to visualize detailed map data and its size can be varied according to underlying values.
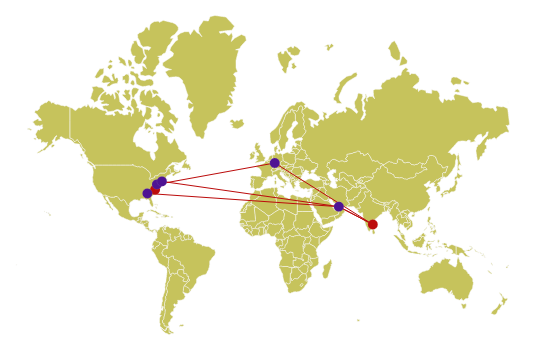
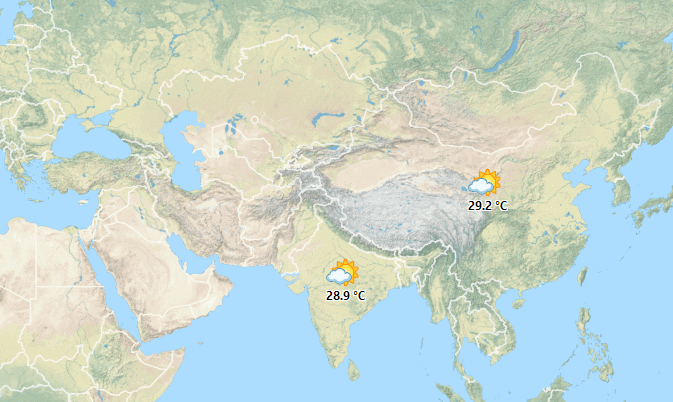
Markers
Design map element markers to showcase your data such as weather, routes etc. at specific mark points based on latitude and longitude position as per your application needs.
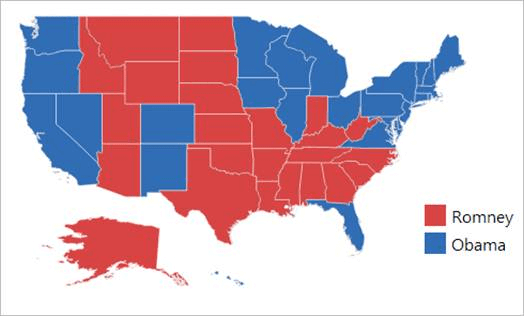
Legends
Design map element legends to showcase swatches of symbols with descriptions or a single rectangle with an interactive arrow to provide valuable information for interpreting the map with various colors, shapes, or other identifiers based on the data and application needs.
75+ jQuery UI WIDGETS
ALL WIDGETS
GRIDS
DATA VISUALIZATION
EDITORS
NAVIGATION
NOTIFICATION
FRAMEWORK
MISCELLANEOUS
BUSINESS INTELLIGENCE
REPORTING
FILE FORMAT LIBRARY
Media
Our Customers Love Us
Having an excellent set of tools and a great support team, Syncfusion® reduces customers’ development time.Here are some of their experiences.

We're using the file formats and Windows/JavaScript list controls a lot. They're fast, easy to use, and the documentation is good and contains examples. Tickets with questions or suggestions were answered within a day, so we're happy to use the Syncfusion libraries.
Using Syncfusion Angular and JavaScript controls makes front-end web development a piece of cake. Each component has many properties that can be configured as per your desire, methods that can be used to interact with the element, and a lot of events that trigger at different stages, which makes modifying your components according to the state of the application an easy task. Also, their support is amazing! They always offer a sample working project, which makes it very simple to solve your question about your code.
Rated by users across the globe
Syncfusion jQuery Resources
Learning
 Documentation
 Documentation


Awards
Greatness—it’s one thing to say you have it, but it means more when others recognize it. Syncfusion® is proud to hold the following industry awards.

