Overview
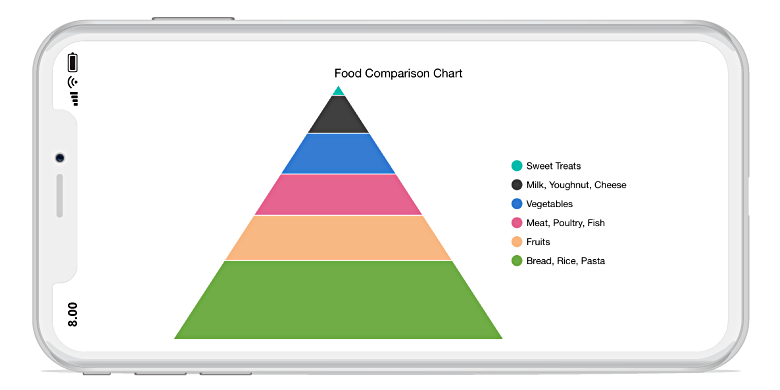
The .NET MAUI Pyramid Chart is the form of a triangle with lines dividing it into sections, each section with a different width. Depending on the Y coordinates, this width indicates a level of hierarchy among other categories. It supports data label, interactive features such as tooltip and selection.
.NET MAUI Pyramid Chart Documentation
Key Features
Rendering Mode
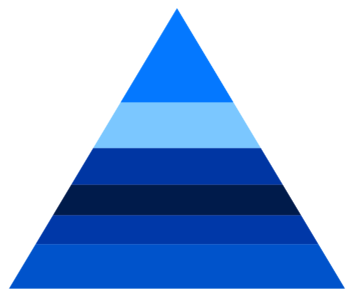
Two types of display modes, linear and surface, are supported by the .NET MAUI Pyramid Chart.

Segment Spacing
The segments in the pyramid chart can be separated by gaps to highlight the levels in the hierarchy.

Explode Segments
Separate a single segment in the pyramid chart to differentiate it from others.

Data Labels
Data labels display information about the data points. Customizing the labels TextColor, FontSize, Stroke, and background.
Code Example
Easily get started with .NET MAUI Pyramid Chart using a few simple lines of XAML and C# code, as demonstrated below.
<ContentPage xmlns="http://schemas.microsoft.com/dotnet/2021/maui"
        xmlns:x="http://schemas.microsoft.com/winfx/2009/xaml"
        x:Class="ChartExample.MainPage"
        xmlns:local="using:ChartExample"
        xmlns:chart="clr-namespace:Syncfusion.Maui.Charts;assembly=Syncfusion.Maui.Charts">

    <Grid>
        <chart:SfPyramidChart Height="300" Width="500"
                ItemsSource="{Binding Data}"
                XBindingPath="Month"
                YBindingPath="Target">
        </chart:SfPyramidChart>
    </Grid>
</ContentPage>
public class Model
{
public string Month { get; set; }
public double Target { get; set; }
public Model(string xValue, double yValue)
{
Month = xValue;
Target = yValue;
}
}
public class ViewModel
{
public ObservableCollection<Model> Data { get; set; }
public ViewModel()
{
Data = new ObservableCollection<Model>()
{
new Model("Jan", 50),
new Model("Feb", 70),
new Model("Mar", 65),
new Model("Apr", 57),
new Model("May", 48),
};
}
}Learning Resources

Explore the .NET MAUI Pyramid Chart example from GitHub to learn how to render and configure charts.

.NET MAUI Pyramid Chart User Guide
Learn more about the available options to customize .NET MAUI Pyramid Chart.
