Overview
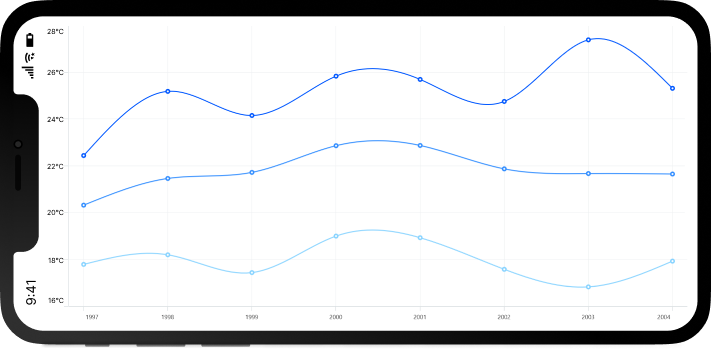
The .NET MAUI spline chart resembles a line chart, with the difference being that instead of connecting the data points with straight lines, the data points are connected by smooth Bezier curves.
.NET MAUI Spline Chart documentation
Key features

Spline types
Four different types of rendering: natural, monotonic, cardinal, and clamped.

Vertical spline chart
Rotate the spline chart to plot data vertically and view data from a different perspective.
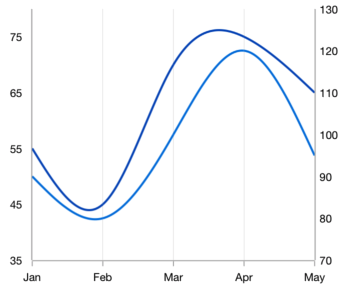
Multiple axes
Use multiple axes to plot different data sets that widely vary from one another.
Code example
<ContentPage xmlns="http://schemas.microsoft.com/dotnet/2021/maui"
        xmlns:x="http://schemas.microsoft.com/winfx/2009/xaml"
        x:Class="ChartExample.MainPage"
        xmlns:local="using:ChartExample"
        xmlns:chart="clr-namespace:Syncfusion.Maui.Charts;assembly=Syncfusion.Maui.Charts">

    <Grid>
        <chart:SfCartesianChart HorizontalOptions="FillAndExpand" VerticalOptions="FillAndExpand">
            <!--Setting BindingContext-->
            <chart:SfCartesianChart.BindingContext>
                <local:ViewModel/>
            </chart:SfCartesianChart.BindingContext>

            <!--Initialize the horizontal axis for the .NET MAUI Cartesian Chart.-->
            <chart:SfCartesianChart.XAxes>
                <chart:CategoryAxis/>
            </chart:SfCartesianChart.XAxes>

            <!--Initialize the vertical axis for the .NET MAUI Cartesian Chart.-->
            <chart:SfCartesianChart.YAxes>
                <chart:NumericalAxis/>
            </chart:SfCartesianChart.YAxes>

            <!--Adding Spline Series to the .NET MAUI Cartesian Chart.-->
            <chart:SplineSeries
                        ItemsSource="{Binding Data}"
                        XBindingPath="Month"
                        YBindingPath="Target">
            </chart:SplineSeries>
        </chart:SfCartesianChart>
    </Grid>
</ContentPage>
public class Model
{
public string Month { get; set; }
public double Target { get; set; }
public Model(string xValue, double yValue)
{
Month = xValue;
Target = yValue;
}
}
public class ViewModel
{
public ObservableCollection<Model> Data { get; set; }
public ViewModel()
{
Data = new ObservableCollection<Model>()
{
new Model("Jan", 50),
new Model("Feb", 70),
new Model("Mar", 65),
new Model("Apr", 57),
new Model("May", 48),
};
}
}Learning resources


.NET MAUI Spline Chart User Guide
Learn more about the available options to customize .NET MAUI spline charts.
