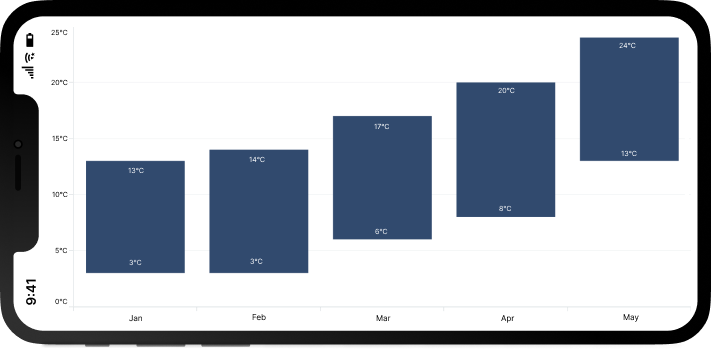
Overview
The .NET MAUI range column chart is used to display a range of data by plotting two y-values per data point. Each y-value used in the range column chart is drawn as the upper and lower bounds of a column. You can create beautiful, animated, real-time, and high-performance range column charts that support interactive features such as zooming and panning, trackball, tooltip, and selection.
Key features

Spacing and width
The .NET MAUI range column chart provides an option to customize the spacing between two rectangles.

Gradient
Apply gradient colors to visualize data in different colors, thus improving the readability and appearance of the chart.

Corner radius
Modernize the chart’s appearance by applying rounded corners to the .NET MAUI range column chart.
Code example
<ContentPage xmlns="http://schemas.microsoft.com/dotnet/2021/maui"
        xmlns:x="http://schemas.microsoft.com/winfx/2009/xaml"
        x:Class="ChartExample.MainPage"
        xmlns:local="using:ChartExample"
        xmlns:chart="clr-namespace:Syncfusion.Maui.Charts;assembly=Syncfusion.Maui.Charts">

    <Grid>
        <chart:SfCartesianChart HorizontalOptions="FillAndExpand" VerticalOptions="FillAndExpand">
            <!--Setting BindingContext-->
            <chart:SfCartesianChart.BindingContext>
                <local:ViewModel/>
            </chart:SfCartesianChart.BindingContext>

            <!--Initialize the horizontal axis for the .NET MAUI Cartesian Chart.-->
            <chart:SfCartesianChart.XAxes>
                <chart:CategoryAxis/>
            </chart:SfCartesianChart.XAxes>

            <!--Initialize the vertical axis for the .NET MAUI Cartesian Chart.-->
            <chart:SfCartesianChart.YAxes>
                <chart:NumericalAxis/>
            </chart:SfCartesianChart.YAxes>

            <!--Adding Range Column Series to the .NET MAUI Cartesian Chart.-->
            <chart:RangeColumnSeries
                        ItemsSource="{Binding Data}"
                        XBindingPath="Month"
                        High="Target" Low="Size">
            </chart:RangeColumnSeries>
        </chart:SfCartesianChart>
    </Grid>
</ContentPage>
public class Model
{
public string Month { get; set; }
public double Target { get; set; }
public double Size { get; set; }
public Model(string xValue, double yValue)
{
Month = xValue;
Target = yValue;
}
public Model(string xValue, double yValue, double size)
{
Month = xValue;
Target = yValue;
Size = size;
}
}
public class ViewModel
{
public ObservableCollection<Model> Data { get; set; }
public ViewModel()
{
Data = new ObservableCollection<Model>()
{
//new Model("Jan", 50),
//new Model("Feb", 70),
//new Model("Mar", 65),
//new Model("Apr", 57),
//new Model("May", 48),
new Model("Jan",7, 2),
new Model("Feb",8, 3),
new Model("Mar",12, 5),
new Model("Apr",16, 7),
new Model("May",20, 11),
};
}
}Learning resources


.NET MAUI Range Column Chart User Guide
Learn about the options available to customize the .NET MAUI range column chart.
