
ASP.NET MVC Sunburst Chart Control
- Ideal for visualizing hierarchical data.
- Customize the appearance of the Sunburst chart completely by using features like data label, legend, animation, etc.
- Zoom the Sunburst chart to get a clear look at each node in a huge collection of data.
Trusted by the world’s leading companies

Overview
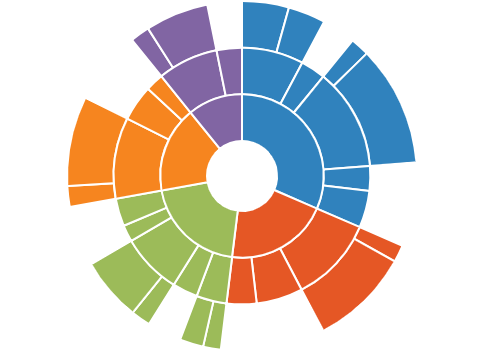
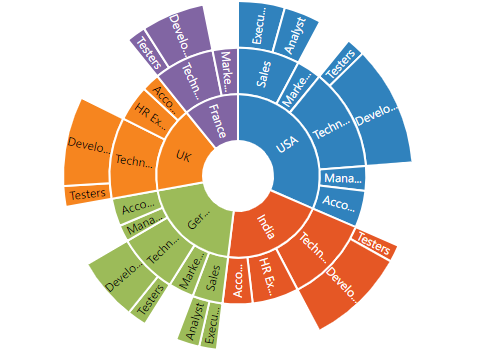
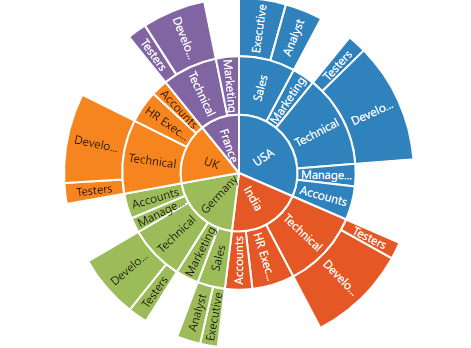
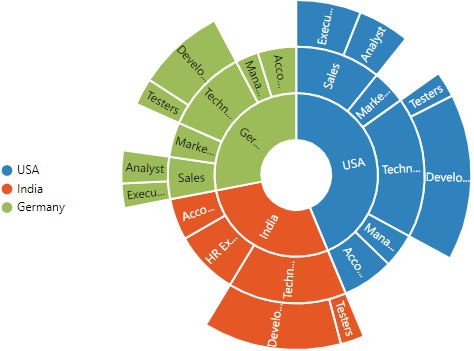
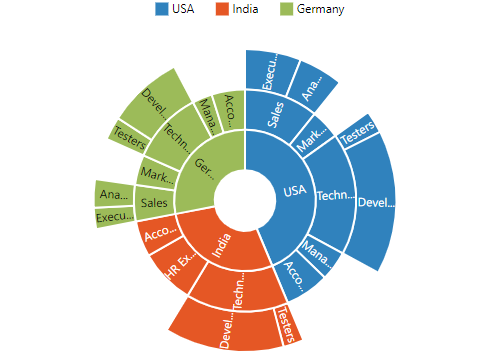
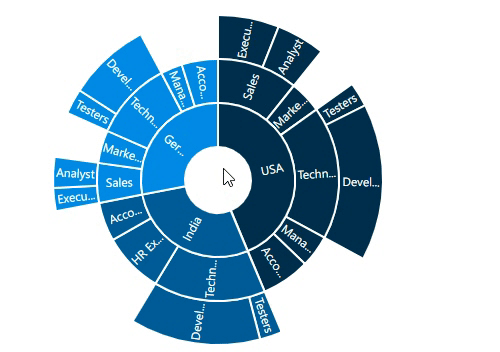
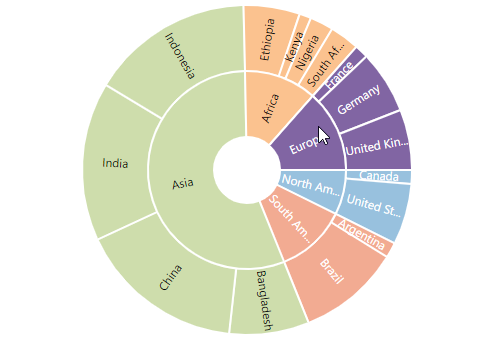
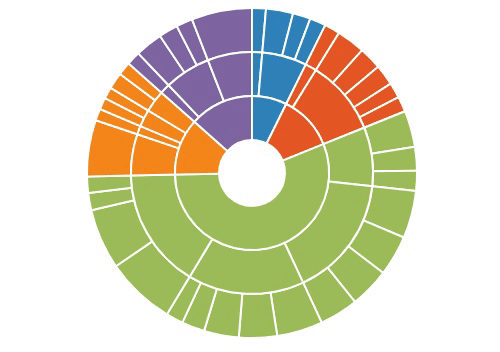
The ASP.NET MVC Sunburst chart control is a data visualization tool, which provides an effective way to visualize hierarchical data. The Sunburst chart looks similar to multiple doughnut charts, where the center circle represents the root level of hierarchy, with outer circles representing higher levels of hierarchy.
Levels
Render any number of child items for each individual segment in the Sunburst chart, and these segments are categorized to form levels.
Data Labels
Data labels in the ASP.NET MVC Sunburst chart control are used to display more information about a particular segment. Labels can be trimmed, or hidden if the label width exceeds the item bounds.
Appearance customization
Customize the appearance of each element in the Sunburst chart to the desired style.
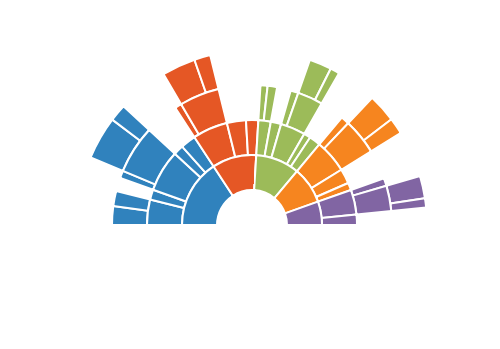
Angle customization
Form half or quarter circle by modifying the start and end angles of the Sunburst chart. This allows the sunburst to render in a very small area.
Radius customization
Fit the Sunburst chart in the available space, by changing the radius of both outer and inner circles.
Legend
The legends in ASP.NET MVC Sunburst chart control provide additional information helpful in identifying the root nodes. Toggle segment visibility or highlight the segment by clicking a legend item.
Legend Position
Position the legend to the top, bottom, left, or right of the Sunburst chart.
Legend item shape
Change the legend item shape to circle, rectangle, or other built-in custom shapes to indicate the segments.
Zooming
The ASP.NET MVC Sunburst chart control provides support to drill parent items to have a more detailed look at their child items.
Tooltip
Displays details about the segment value through a tooltip by hovering the mouse over the segment. Use any HTML element as a tooltip.
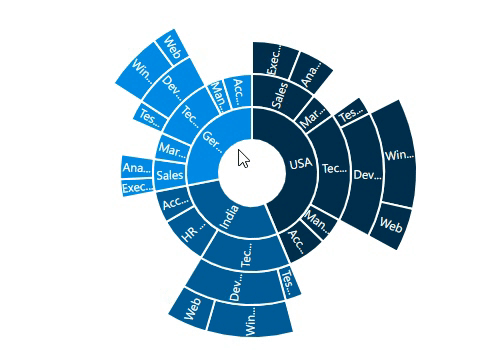
Selection and highlight
Select a particular segment on mouse click and highlight on mouse hover to bring the center of attraction over other segments on the Sunburst chart.
Animation
The ASP.NET MVC Sunburst chart control provides a visually appealing way to view its segments with animated transitions for a certain duration. Experience smooth rendering on segments of drill-down also.
Touch and responsive support
The interactive Sunburst chart control also supports touch interactions.

Touch support
All the Sunburst chart features will work on touch devices with zero configuration. Use the touch features such as tooltip and track line without any customization.
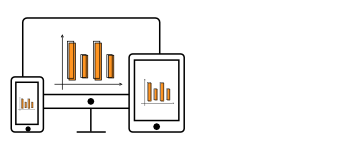
Responsive
You can view the ASP.NET MVC Sunburst chart control on various devices. You can also, hide specific elements in the sunburst for particular screen sizes by making minimal change in the events.

Cross-browser support
You can render the Sunburst chart control in all the modern browsers.
85+ ASP.NET MVC UI CONTROLS
ALL CONTROLS
GRIDS
DATA VISUALIZATION
DATA SCIENCE
EDITORS
NAVIGATION
NOTIFICATION
FILE FORMAT FRAMEWORKS
REPORTING
BUSINESS INTELLIGENCE
Rated by users across the globe
Awards
Greatness—it’s one thing to say you have it, but it means more when others recognize it. Syncfusion® is proud to hold the following industry awards.

