Essential Studio® Flutter Error Bar Chart & Graph
Overview
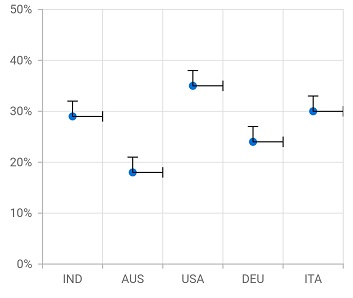
The Flutter Error bar chart is graphical representations of the variations of data and used on graphs to indicate the errors or uncertainty in a reported measurement.

Key features

Customization
Customize the color, thickness and cap length with built-in APIs to make it visually unique.

Drawing mode
The Error bar chart supports different types of drawing modes such as horizontal, vertical, and both.
Drawing direction
The Error bar chart renders in plus, minus, and both directions.


