.NET Excel Examples
Create a Chart in an Excel Worksheet with the Syncfusion .NET Excel Library
Overview
The Syncfusion® .NET Excel Library (XlsIO) enables you to create, read, and edit Excel documents programmatically without Microsoft Excel or interop dependencies. Using this library, you can create a chart in a worksheet using C#.
Watch this video to see how to create a chart in an Excel worksheet using the Syncfusion .NET Excel Library:
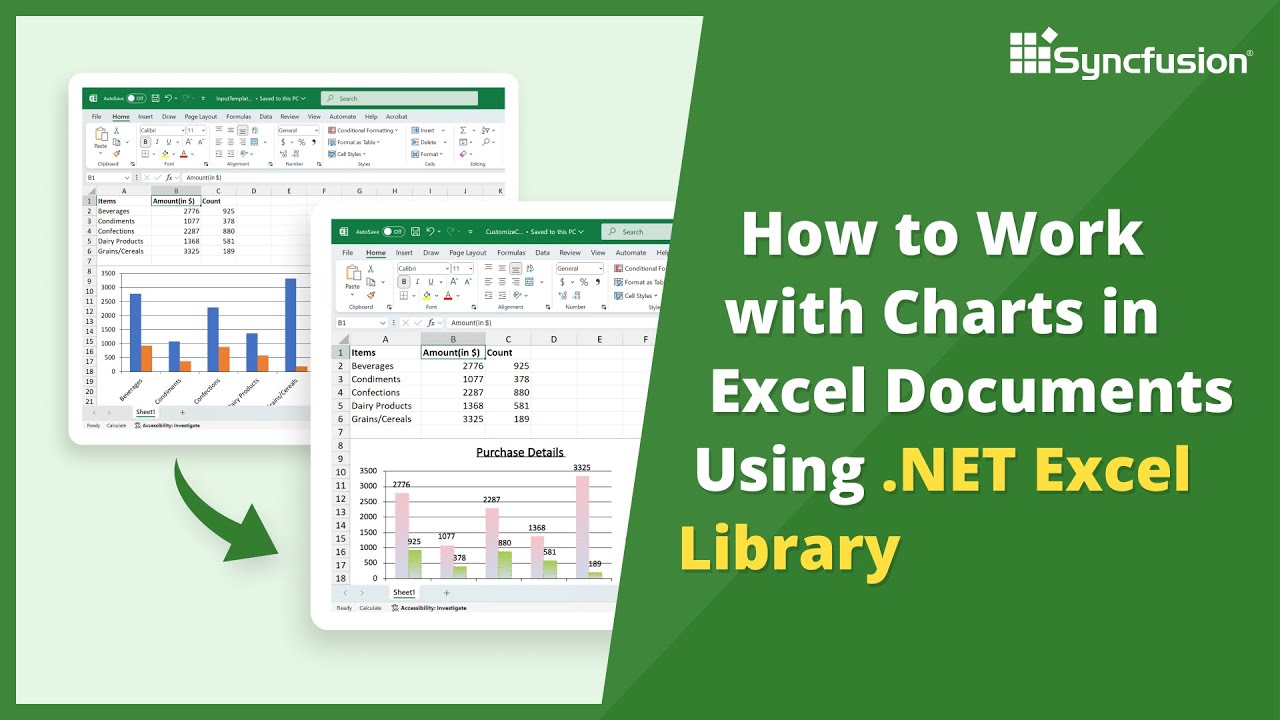
Create a chart in an Excel worksheet
Follow these steps to create a chart in an Excel worksheet using the Syncfusion .NET Excel Library.
Step 1: Create a new project
Start by creating a new C# Console Application project.
Step 2: Install the NuGet package
Add the Syncfusion.XlsIO.Net.Core package to your project from NuGet.org.
Step 3: Include namespaces
Add the following namespaces to your Program.cs file:
using System.IO;
using Syncfusion.XlsIO;
Step 4: Add code to create a chart in the Excel worksheet
Use the following code in the Program.cs file to create a chart in the Excel worksheet.
using (ExcelEngine excelEngine = new ExcelEngine())
{
	IApplication application = excelEngine.Excel;
	application.DefaultVersion = ExcelVersion.Xlsx;
	FileStream inputStream = new FileStream(Path.GetFullPath(@"Data/InputTemplate.xlsx"), FileMode.Open, FileAccess.Read);
	IWorkbook workbook = application.Workbooks.Open(inputStream, ExcelOpenType.Automatic);
	IWorksheet sheet = workbook.Worksheets[0];

	//Create a chart.
	IChartShape chart = sheet.Charts.Add();

	//Set chart type.
	chart.ChartType = ExcelChartType.Column_Clustered;

	//Set data range in the worksheet.
	chart.DataRange = sheet.Range["A1:C6"];
	chart.IsSeriesInRows = false;

	//Set data labels.
	IChartSerie serie1 = chart.Series[0];
	IChartSerie serie2 = chart.Series[1];

	serie1.DataPoints.DefaultDataPoint.DataLabels.IsValue = true;
	serie2.DataPoints.DefaultDataPoint.DataLabels.IsValue = true;
	serie1.DataPoints.DefaultDataPoint.DataLabels.Position = ExcelDataLabelPosition.Outside;
	serie2.DataPoints.DefaultDataPoint.DataLabels.Position = ExcelDataLabelPosition.Outside;

	//Set legend.
	chart.HasLegend = true;
	chart.Legend.Position = ExcelLegendPosition.Bottom;

	//Positioning the chart in the worksheet.
	chart.TopRow = 8;
	chart.LeftColumn = 1;
	chart.BottomRow = 23;
	chart.RightColumn = 8;

	#region Save
	//Saving the workbook.
	FileStream outputStream = new FileStream(Path.GetFullPath(@"Output/Chart.xlsx"), FileMode.Create, FileAccess.Write);
	workbook.SaveAs(outputStream);
	#endregion

	//Dispose streams.
	outputStream.Dispose();
	inputStream.Dispose();
}
GitHub project
NuGet installation
Get started quickly by downloading the installer and and checking license information on the Downloads page.
Table of contents
Explore these resources for comprehensive guides, knowledge base articles, insightful blogs, and ebooks.
Learning


Technical support


