Skip to content
Blogs
Search blogs
Chart of the week (141)
Chart of the week
Copy RSS feed for this category
11 min read
Jan 9, 2026
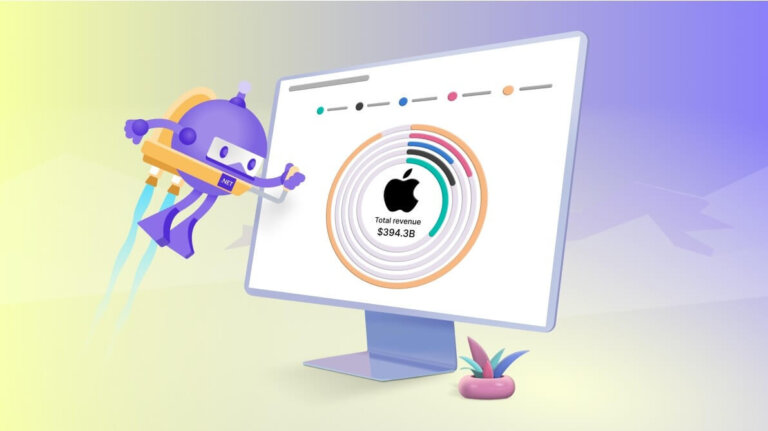
Chart of the Week: Creating the .NET MAUI Radial Bar to Visualize Apple’s Revenue Breakdown
Vimala Thirumalai Kumar
9 min read
Mar 21, 2025
Chart of the Week: Creating a .NET MAUI Doughnut Chart to Visualize the World's Biggest Oil Producers
Ezhilarasan Elangovan
9 min read
Dec 30, 2025
Creating the .NET MAUI Scatter Chart to Visualize Different Sports Ball Sizes and Weights
Harsha Midadhala
6 min read
Jan 19, 2026
Chart of the Week: Creating a WPF Pie Chart to Visualize the Percentage of Global Forest Area for Each Country
Arul Jenith Berkmans
11 min read
Jan 9, 2026
Chart of the Week: Visualizing Gender Parity in Industrial Employment with .NET MAUI Bubble Chart
Dhanaraj Rajendran
7 min read
Jan 12, 2026
Chart of the Week: Creating a .NET MAUI Histogram Chart to Display the Distribution of Atomic Weights in the Periodic Table
Surya Karan Raja
10 min read
Jan 19, 2026
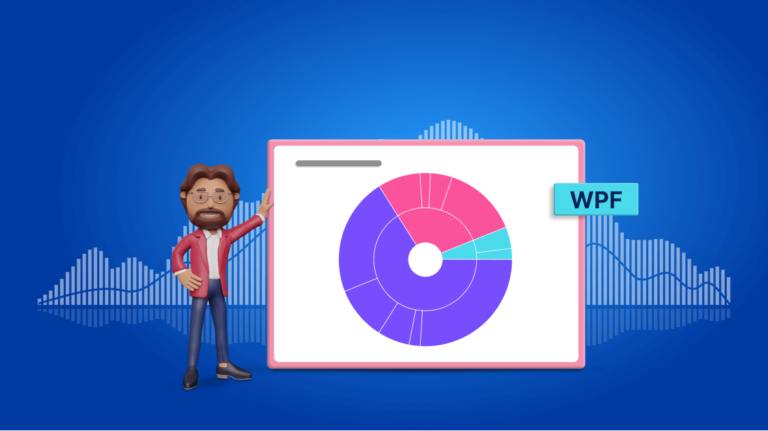
Chart of the Week: Creating a WPF Sunburst Chart to Visualize the Syncfusion Chart of the Week Blog Series
Saiyath Ali Fathima M
13 min read
Jan 15, 2026
Chart of the Week: Creating a .NET MAUI Line Chart with Plot Bands to Explore Global GNI Per Capita with Income Thresholds
Sowndharya Selladurai
8 min read
Jan 9, 2026
Reached 50! A Milestone for the Chart of the Week Blog Series
Vimala Thirumalai Kumar
1
…
7
8
9
10
11
12
13
…
16
1
…
9
10
11
…
16
 Vimala Thirumalai Kumar

 Ezhilarasan Elangovan

 Harsha Midadhala

 Arul Jenith Berkmans

 Dhanaraj Rajendran

 Surya Karan Raja
 Saiyath Ali Fathima M

 Sowndharya Selladurai