Skip to content
Blogs
Search blogs
Chart of the week (141)
Chart of the week
Copy RSS feed for this category
8 min read
Jan 15, 2026
Chart of the Week: Creating a .NET MAUI Line Chart to Analyze Wage Trends in the Texas Oil Gas Extraction Industry
Nanthini Mahalingam
7 min read
Jan 19, 2026
Chart of the Week: Creating a WPF 100% Stacked Area Chart to Visualize the World Vehicle Production in Major Countries
Karthikeyan V
7 min read
Jan 9, 2026
Chart of the Week: Creating a .NET MAUI Sunburst Chart to Visualize the Most Popular Wikipedia Articles
Saiyath Ali Fathima M
11 min read
Jan 19, 2026
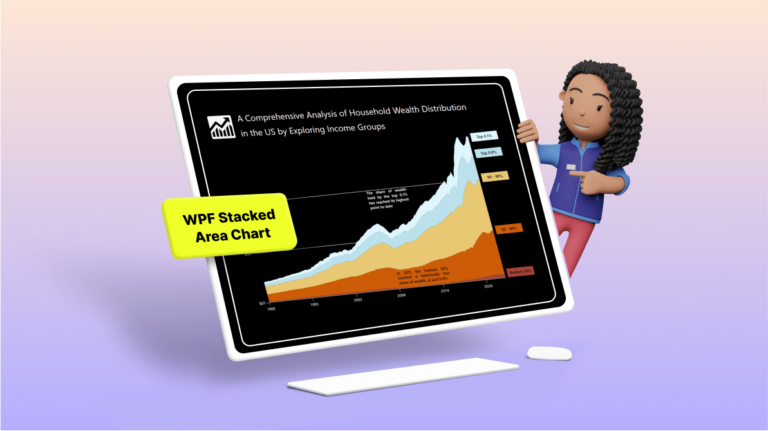
Chart of the Week: Creating a WPF Stacked Area Chart to Visualize Wealth Distribution in the U.S.
Arul Jenith Berkmans
12 min read
Jan 12, 2026
Chart of the Week: Creating a Custom .NET MAUI Bar Chart for Global Renewable Energy Employment Trends
Vimala Thirumalai Kumar
8 min read
Jan 19, 2026
Chart of the Week: Creating a WPF 3D Column Chart to Visualize the Panama Canal’s Shipment Transit Data
Surya Karan Raja
10 min read
Jan 12, 2026
Chart of the Week: Creating a .NET MAUI Column Chart to Visualize the Corporate Investment in AI
Saiyath Ali Fathima M
11 min read
Feb 10, 2026
Creating a .NET MAUI Fast Line Chart to Visualize the Arctic Sea Ice Extent Since 2000
Sneha Kumar
12 min read
Jan 19, 2026
Chart of the Week: Creating a WPF Chart Dashboard to Visualize the 2023 World Billionaires List
Sowndharya Selladurai
1
…
8
9
10
11
12
13
14
…
16
1
…
10
11
12
…
16

 Nanthini Mahalingam

 Karthikeyan V

 Saiyath Ali Fathima M
 Arul Jenith Berkmans

 Vimala Thirumalai Kumar

 Surya Karan Raja


 Sneha Kumar

 Sowndharya Selladurai