


Data organization and summaries
Group records by selected fields and calculate totals, counts, averages, and custom summary values to uncover patterns, streamline analysis, and gain deeper insights from large datasets.
Data grouping
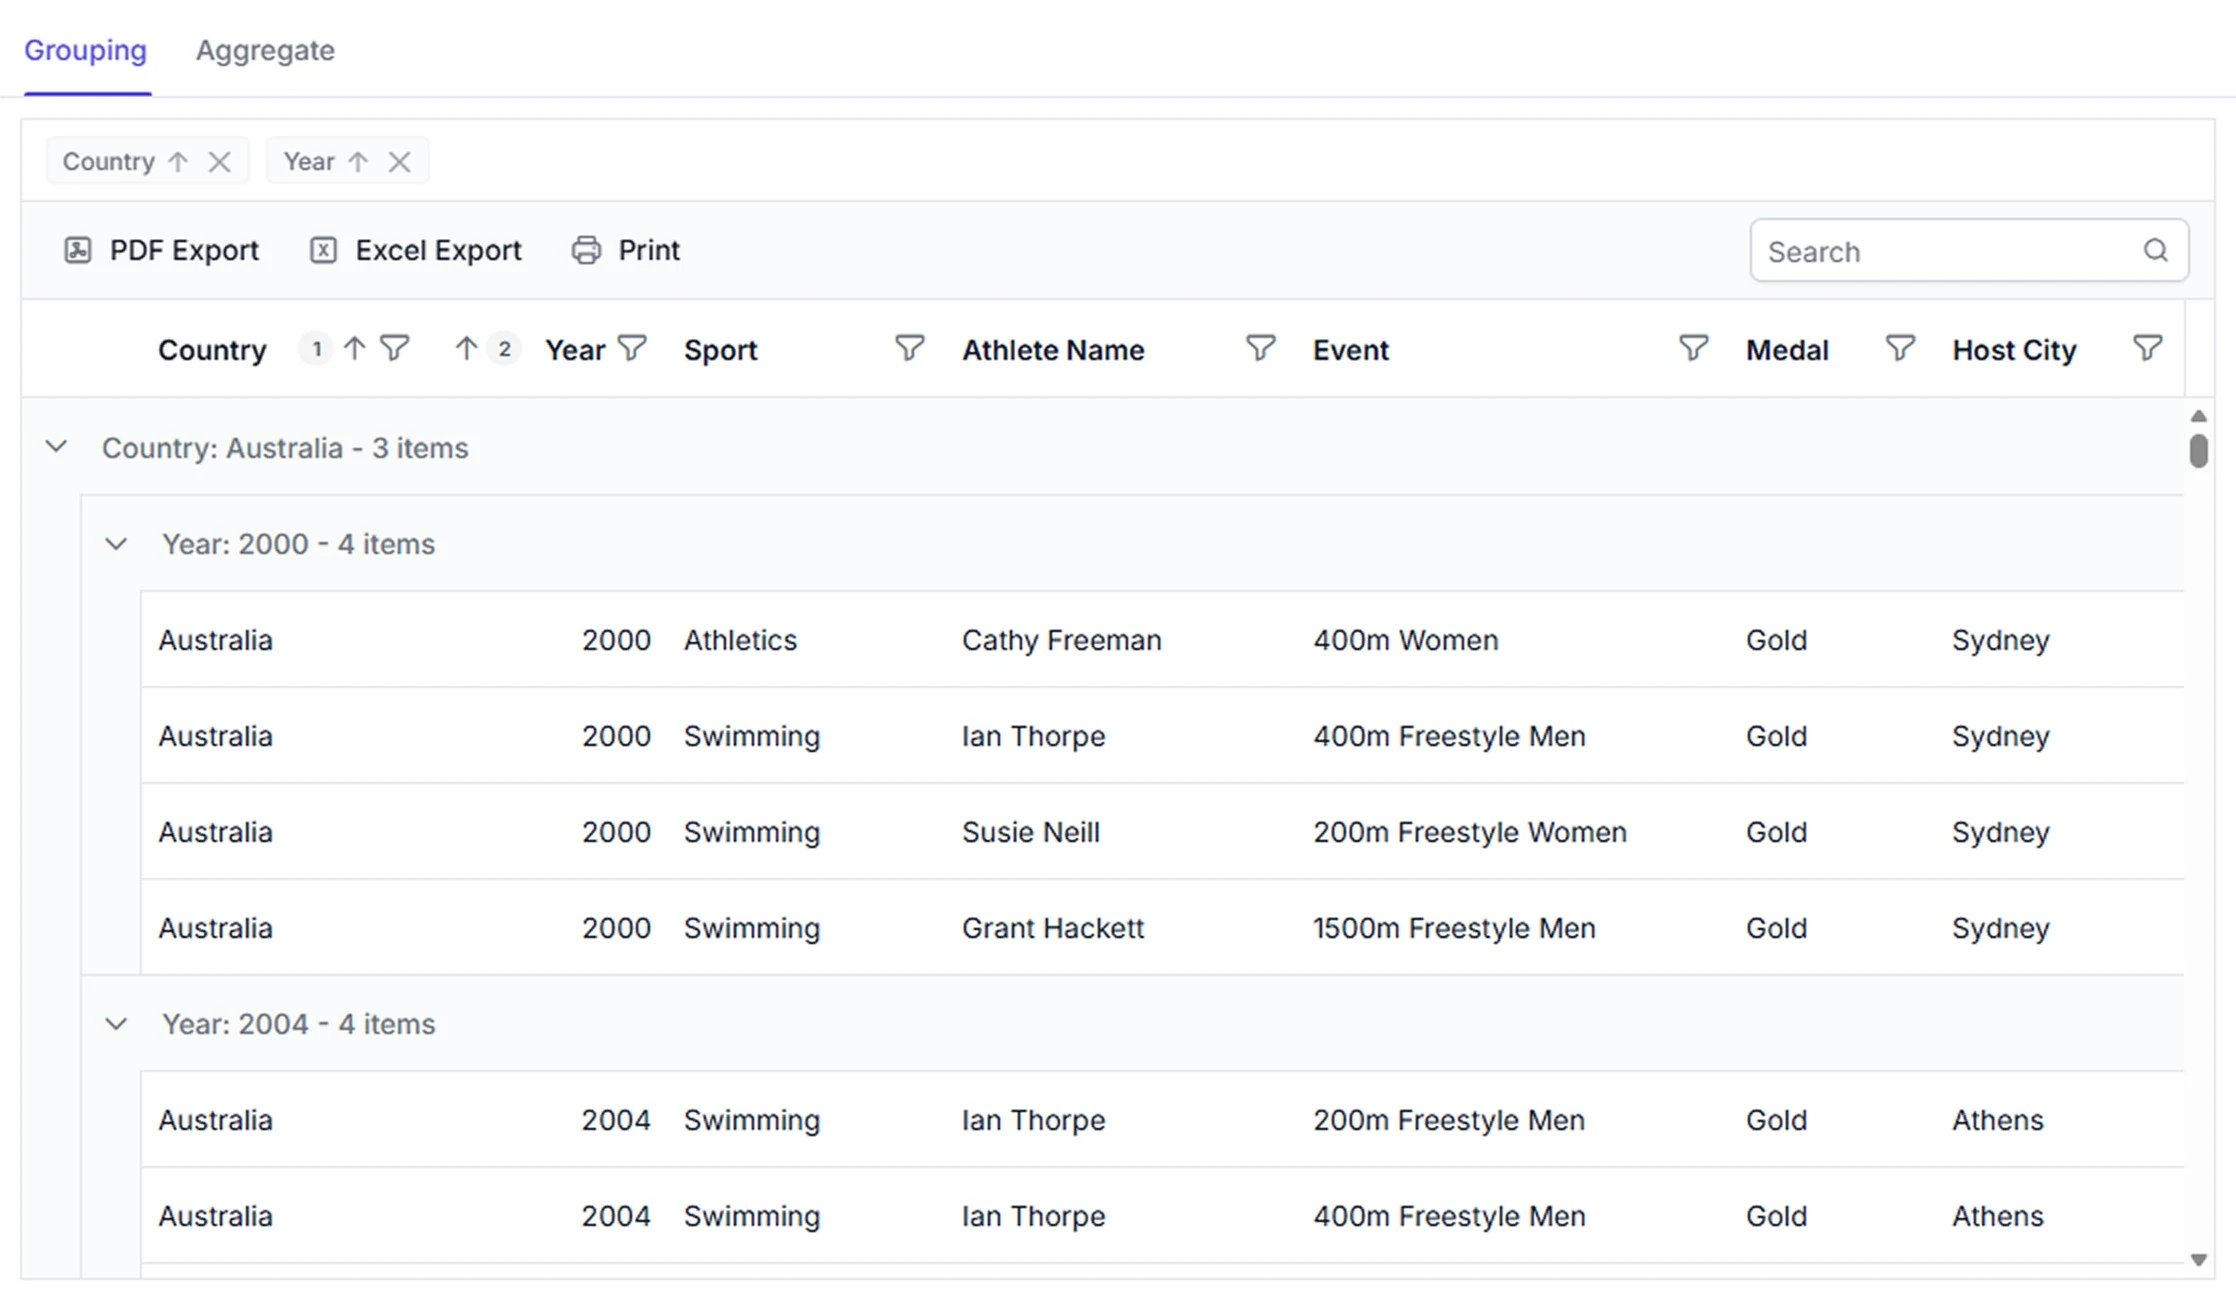
Group records based on column values to organize related data into categories. Use this feature to analyse, compare, and review records within grouped datasets.
Aggregate calculations
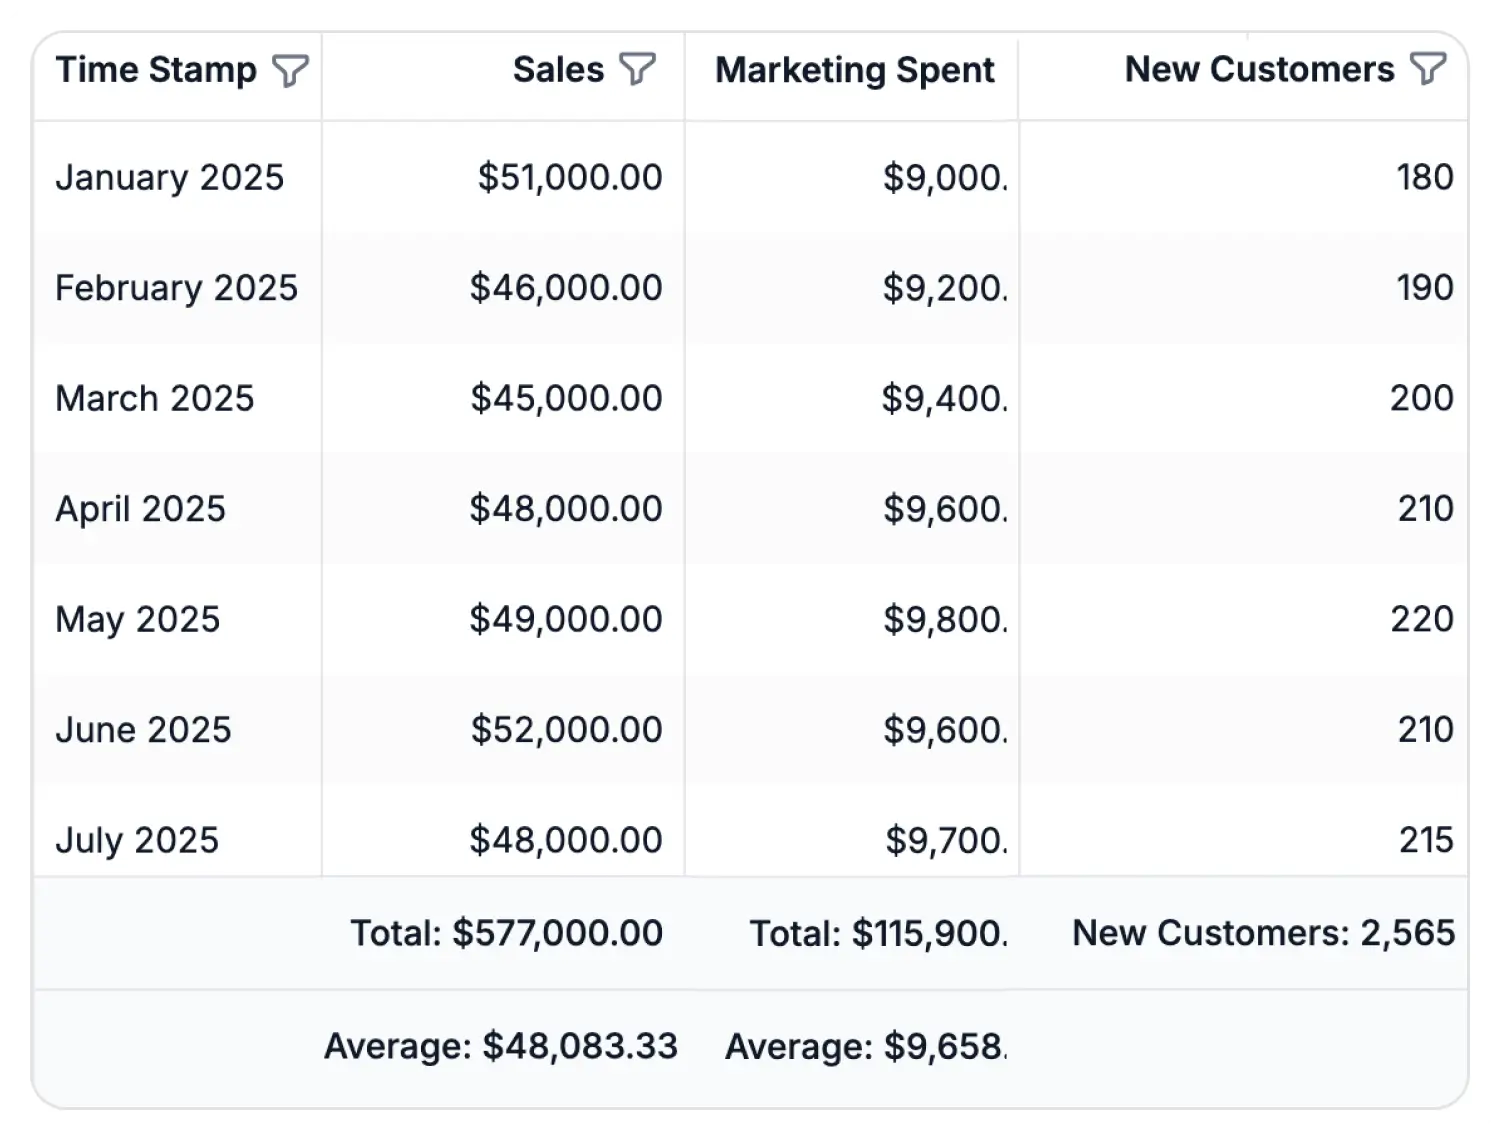
Data Grid aggregation summarizes column values using built-in functions such as sum, average, minimum, maximum, and count. Custom aggregation formulas can be applied to display summary values in the Grid footer. Use this feature to review key metrics and analyse data across records.
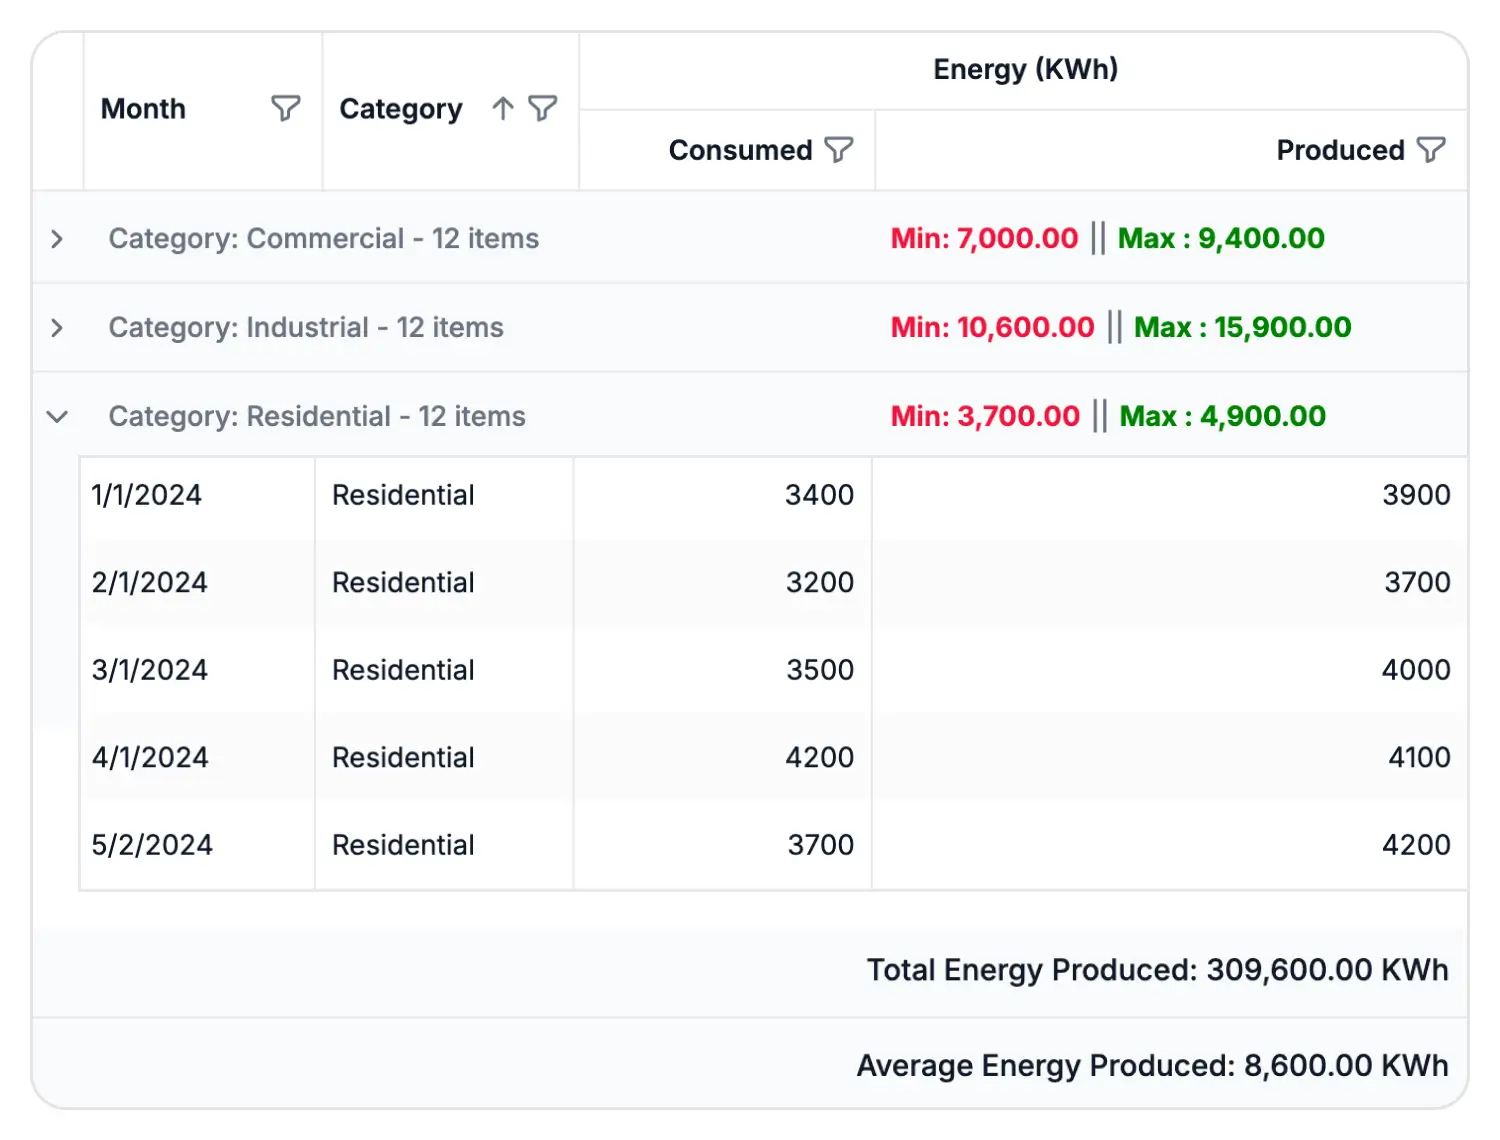
Group aggregates
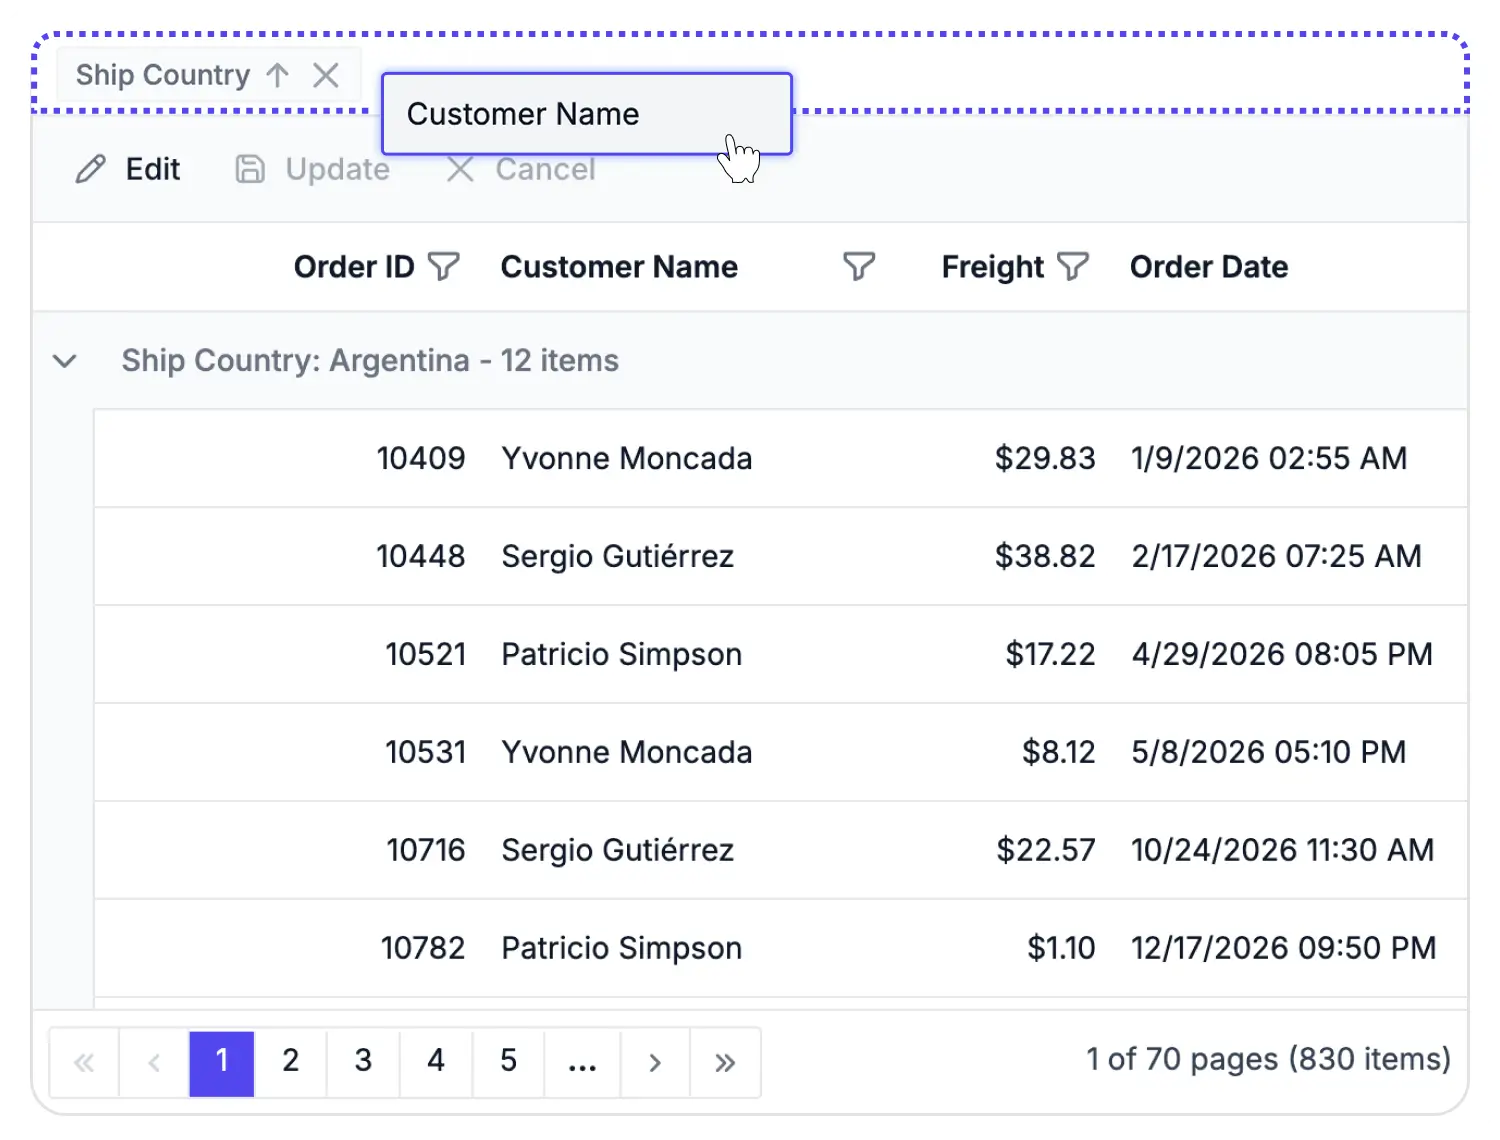
Display aggregate values within each group using caption and footer summaries. Each group maintains its own summary values based on the records it contains, including totals, counts, minimum, maximum, average, and custom aggregates. Use this feature to analyse and compare grouped data.
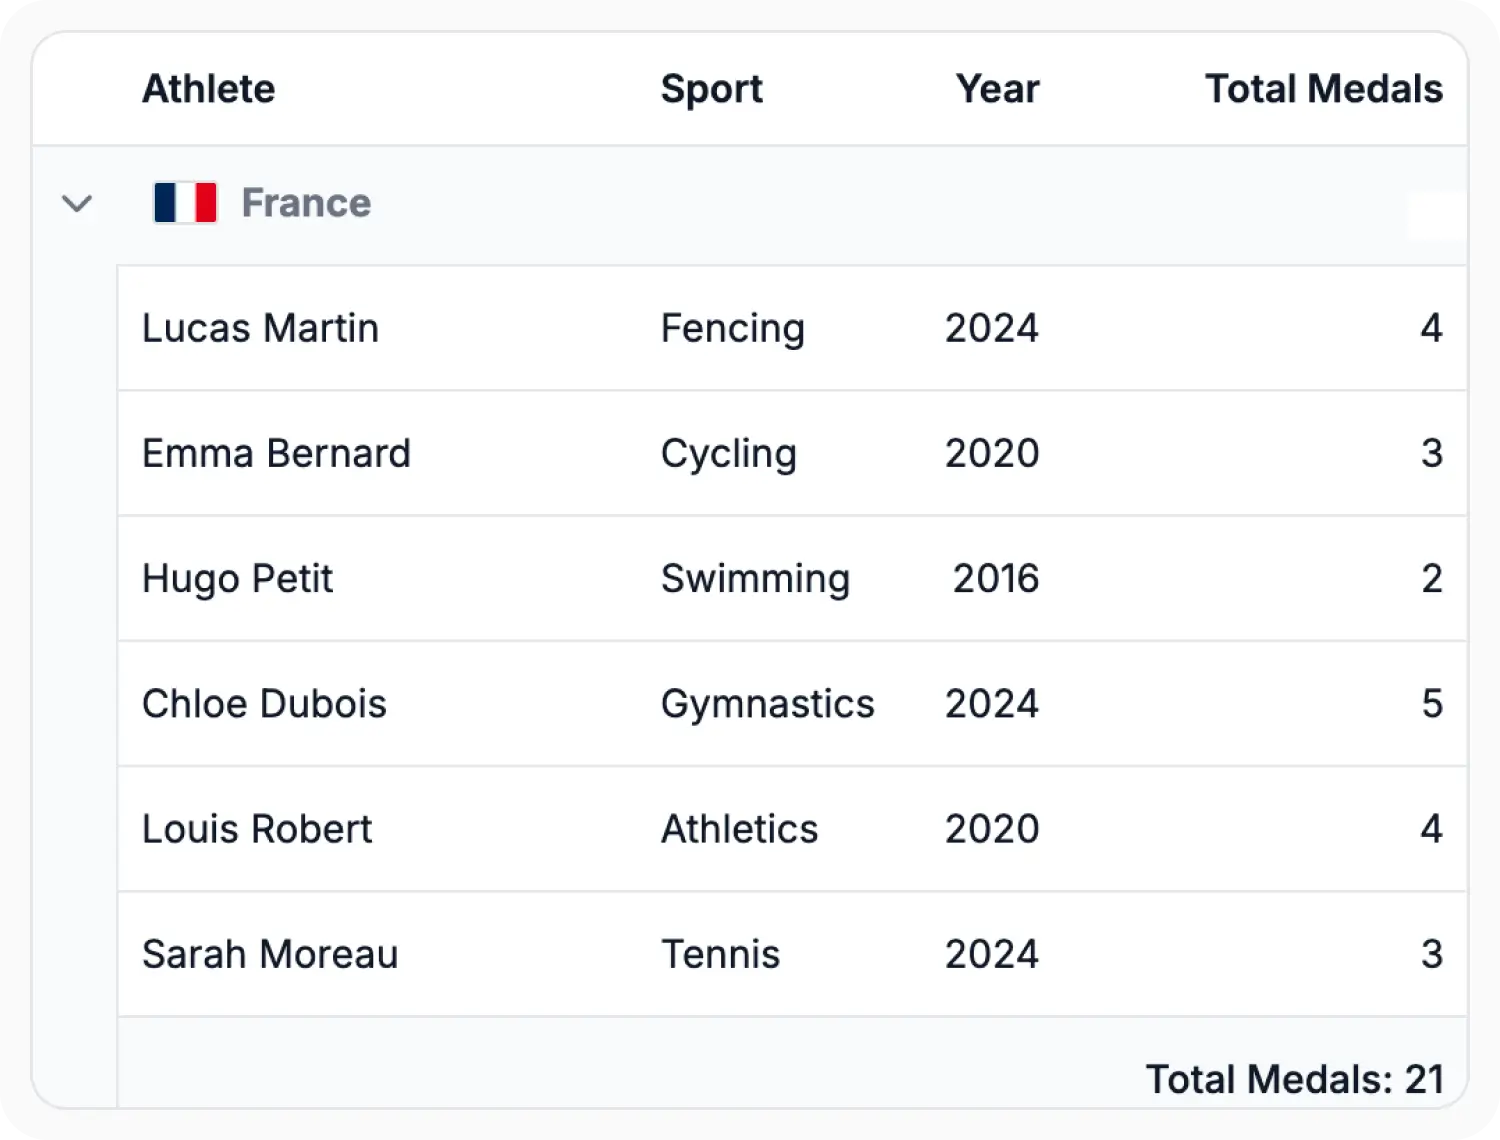
Caption and footer templates
Group caption and aggregate footer templates allow customized group captions and footer summaries with formatted values, counts, totals, and custom content. Use this feature when grouped data or summary information requires a custom presentation.
See Why Developers Love Syncfusion
Our Customers Love Us
Having an excellent set of tools and a great support team, Syncfusion reduces customers’ development time. Here are some of their experiences.




Frequently Asked Questions
How can data be grouped by multiple columns in React Data Grid?
Yes. React Data Grid supports multi-column grouping, allowing records to be grouped by multiple fields to create hierarchical categories and analyze data at different levels.
How can grouping be removed programmatically in React Data Grid?
React Data Grid provides built-in APIs to remove grouping from individual columns or reset all grouped columns programmatically. This enables grouping state to be reset based on user actions or application logic.
Can aggregate values update automatically when data changes in React Data Grid?
Yes. React Data Grid supports reactive aggregates that automatically recalculate and update summary values when records are added, edited, or deleted. This helps keep totals, counts, averages, and other aggregate values synchronized with the latest data.
Can grouped columns be reordered in React Data Grid for better data organization?
Yes. Grouped columns can be reordered to change the grouping hierarchy. This helps reorganize grouped data and adjust how records are categorized and displayed.
Can grouped rows be expanded and collapsed programmatically in React Data Grid?
Yes. React Data Grid provides built-in APIs to expand or collapse individual groups or all grouped records programmatically. This helps control the visibility of grouped data based on application requirements and user interactions.
Can group summaries be customized in React Data Grid?
Yes. React Data Grid provides customization options for displaying summary information within grouped records. This helps align grouped summary values with reporting and application requirements.
Resources
Learn more about React Data Grid Grouping and Aggregation
Explore demos, KB articles, and documentation to get the most out of the Data Grid.
Explore guides, setup details, and quick-start tips.
See live use cases in action.
Ask, share, and connect with peers.
Find solutions and best practices fast.
Get expert help when needed.
Feature requests and bug reports
Track issues and suggest improvements.
See Real Success Stories
Developers around the world trust Syncfusion’s Essential Studio to simplify complex projects and speed up delivery. With a vast library of UI controls, powerful SDKs, and reliable support, Essential Studio helps teams build enterprise-ready applications with confidence.
Read Our Customer StoriesIndustry
Software development
75% Cost reduction
50% Faster development

Industry
Utilities (oil and gas)

450+ hours saved
Streamlined processes and hours of development effort saved.

Advanced, flexible features
Empowered users through robust and versatile functionality.
Industry
Software and technology
1000+ of hours saved
Accelerated development with enterprise-ready UI components.

Efficient file management
Streamlined workflows with document libraries without building them from scratch.
Industry
Software and technology

2 Years of delay avoided
Two years of delays prevented with proactive planning.

On-time delivery
Projects delivered on schedule using trusted controls.
Industry
IT services and IT consulting

Improved performance
Large datasets handled with easy customization and quick debugging.

Highly customizable
Plug-and-play controls with quick template integration.
Industry
Professional services
Instant access
Quick availability of features and resources.
Reduced dependencies
Fewer dependencies for faster development.
Awards
Greatness—it’s one thing to say you have it, but it means more when others recognize it. Syncfusion® is proud to hold the following industry awards.