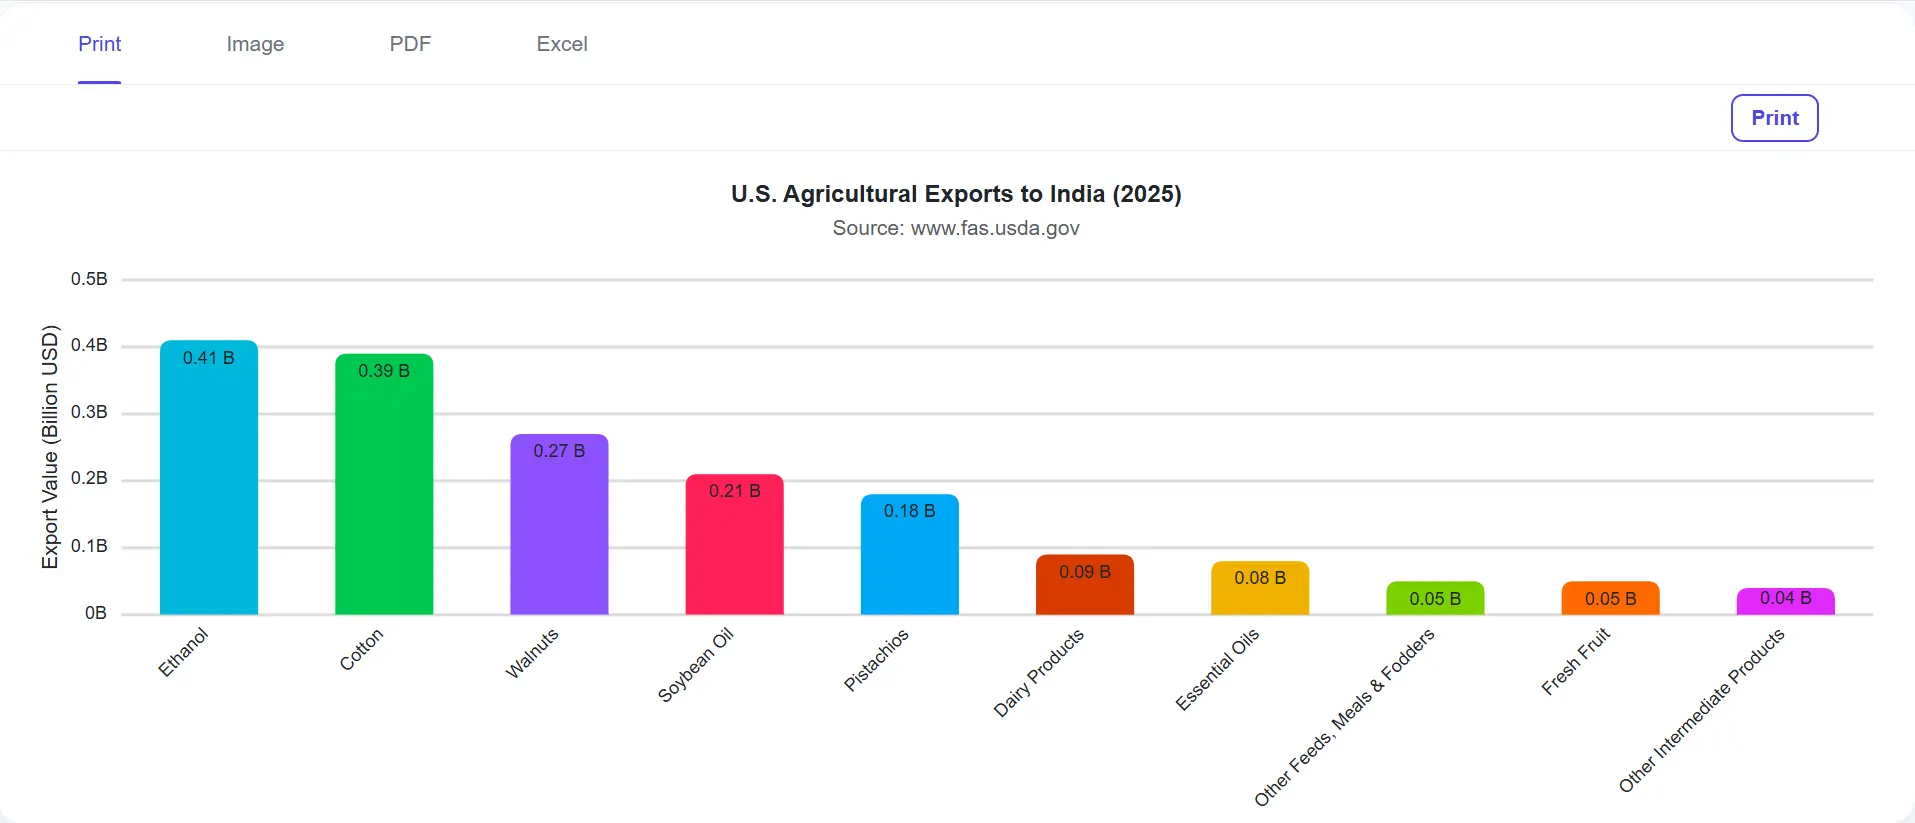



Explore React Charts Print and Export Options
Export and print React Charts in multiple formats, including images, PDF, Excel, and CSV. Share presentation-ready visuals, generate reports, or reuse chart data with flexible export options that support seamless collaboration and analysis.
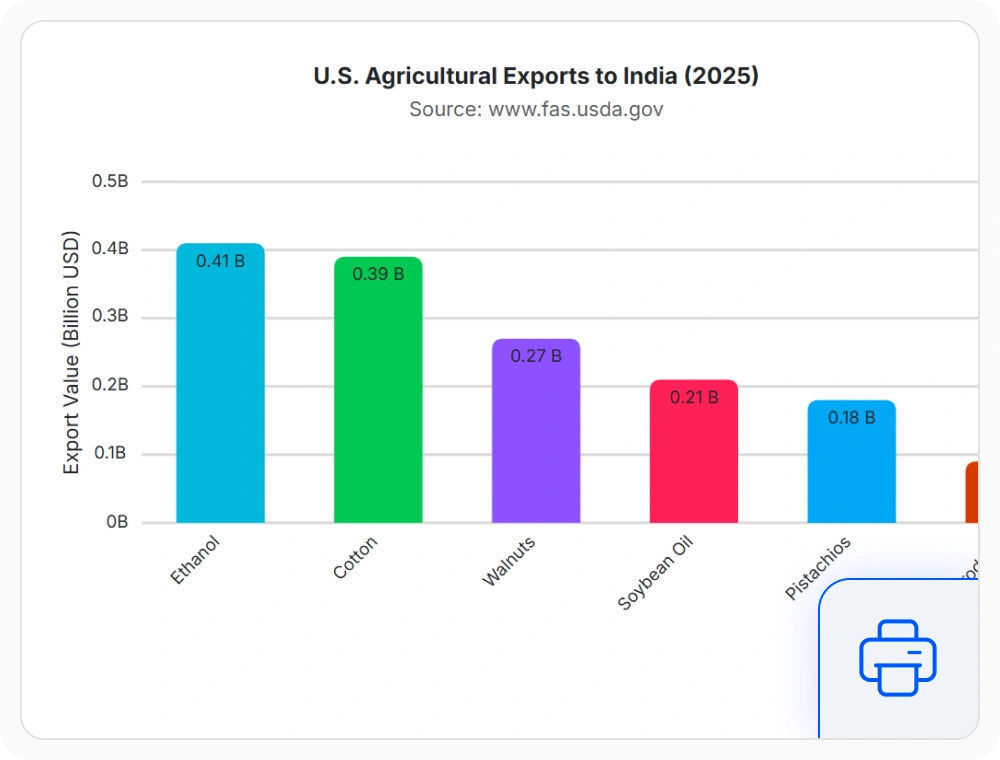
Print charts directly from browser
Print chart visualizations directly from the browser without exporting them to a separate file. This helps users quickly produce high-quality hard copies while preserving chart formatting, styling, and visual clarity. Use it when sharing charts during meetings, presentations, reviews, or operational discussions.
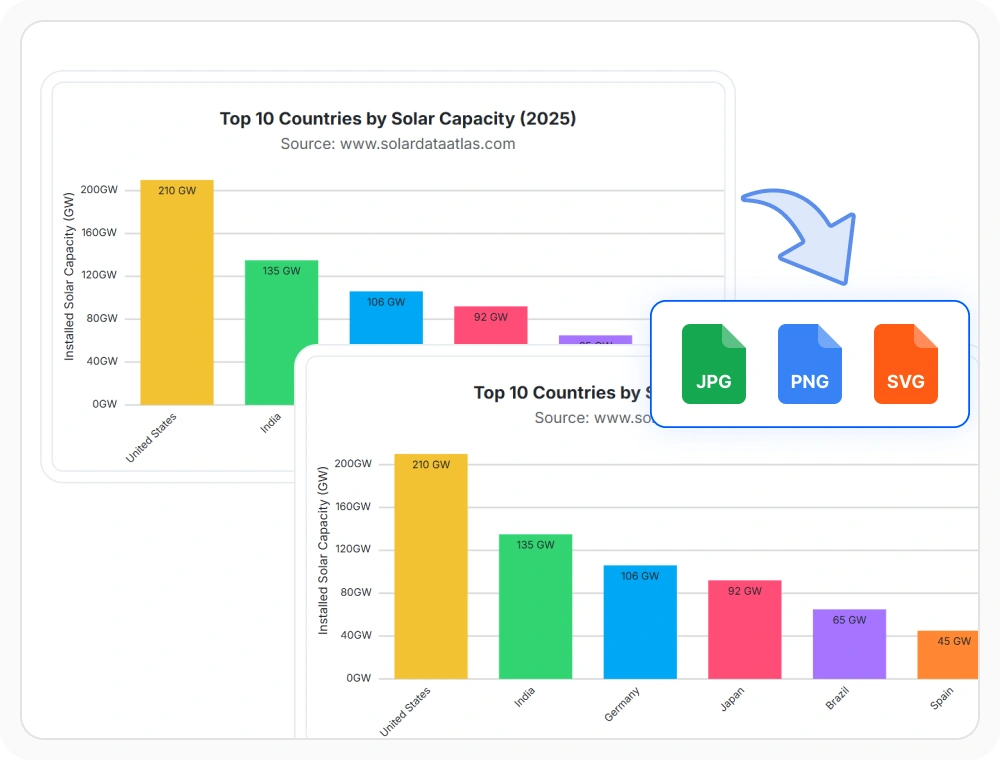
Export charts as image files
Export chart visualizations as PNG, JPEG, or SVG image files for easy sharing and reuse. This helps teams incorporate charts into presentations, reports, documentation, and communication materials while preserving visual quality. Use it when chart visuals need to be viewed, shared, or distributed outside the application.
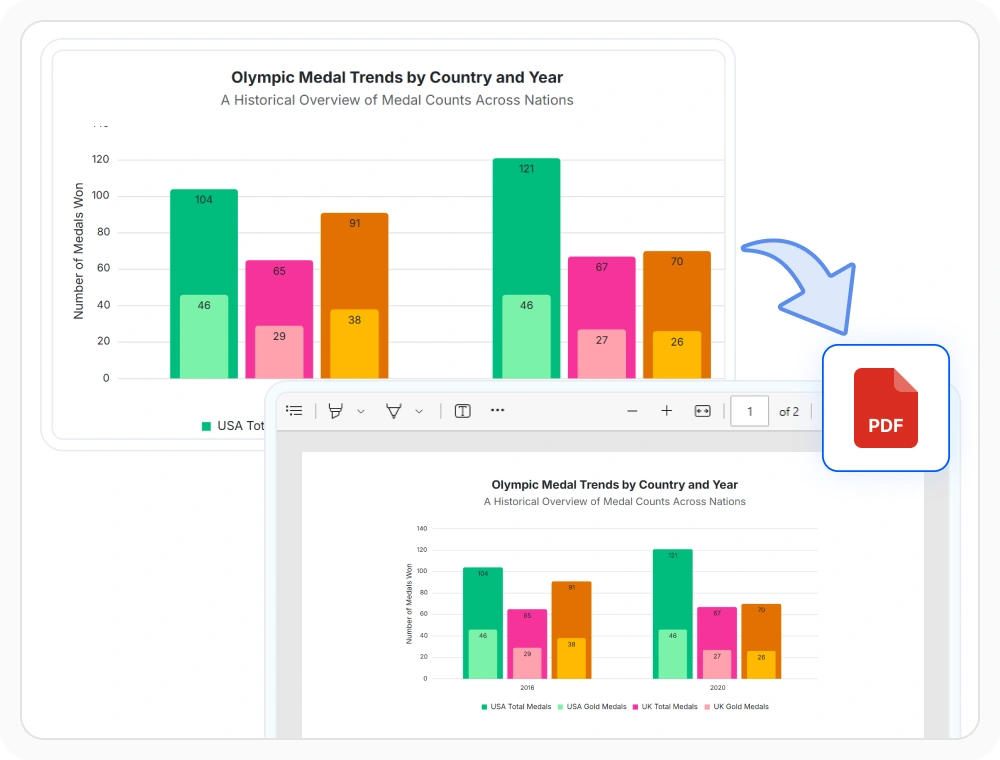
Generate PDF reports and documents
Export chart visualizations as PDF documents for reporting, sharing, and long-term storage. PDF exports preserve chart formatting, styling, and layout across devices, making them ideal for professional reporting workflows. Use it when creating formal reports, presentations, or business documentation.
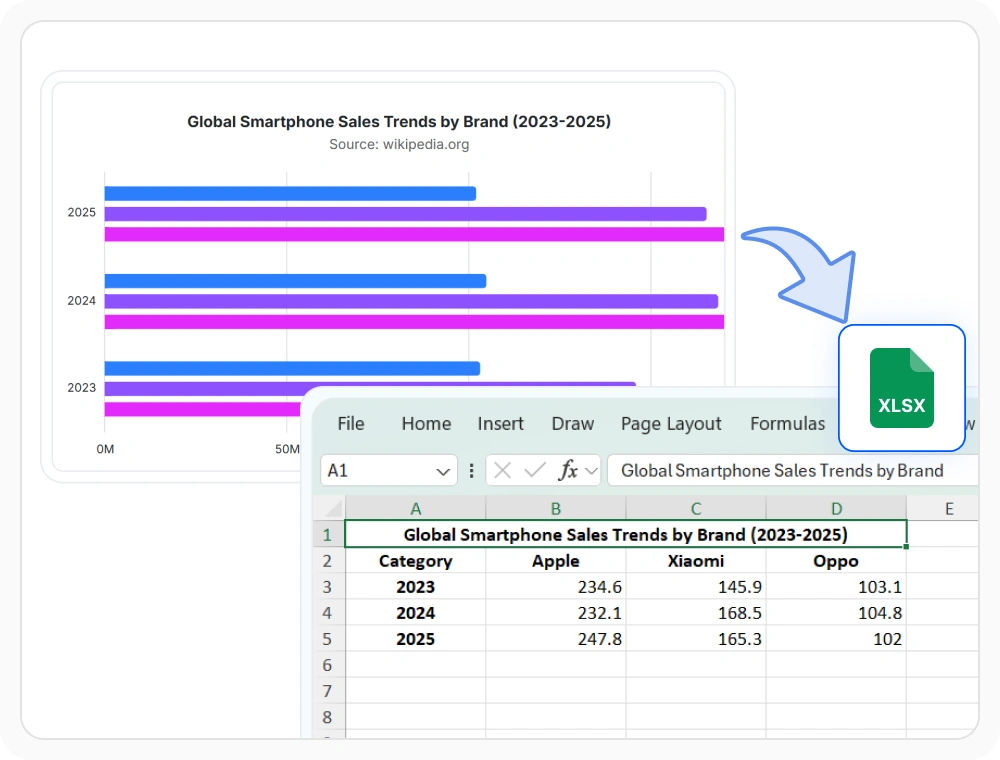
Export data to Excel easily
Export chart data to Excel for detailed analysis, reporting, and collaboration. This allows users to sort, filter, calculate, and reuse data outside the chart while integrating with existing spreadsheet-based workflows. Use it when teams need to perform additional analysis or share underlying data.
See Why Developers Love Syncfusion
Our Customers Love Us
Having an excellent set of tools and a great support team, Syncfusion reduces customers’ development time. Here are some of their experiences.




Frequently Asked Questions
What are the print and export capabilities in React Charts?
Print and export lets you print charts directly or save them as an image, PDF, Excel, and CSV files for quick and easy sharing and further analysis.
Is React Charts export processing occurs entirely on the client side?
Yes. React Charts print and export processing occurs entirely on the client side within the browser, eliminating server-side dependencies and improving overall performance.
Which React Charts export format is best for formal reports?
PDF export is typically best for formal reports since it provides fixed-format output that displays consistently across systems while supporting configurable orientation and page sizing.
What file formats does React Charts export support?
Supported export formats include PNG and JPEG images, SVG vector format, PDF documents, Excel workbooks, and CSV data files for flexibility.
Which React Charts export format is best for presentations?
Image export such as PNG, JPEG, or SVG works best for presentation since images embed easily into slides and documents without needing special software.
When should React Charts data be exported to Excel?
Export to Excel whenever teams need to analyze chart data further, apply calculations, build additional summaries, or integrate data with other spreadsheet-based workflows.
Resources
Learn more about our React Charts
Explore demos, KB articles, and documentation to get the most out of our React Charts.
Explore guides, APIs, and quick-start tips
Find solutions and best practices fast
See live use cases in action
Get expert help when you need it
Ask, share, and connect with peers
Feature requests and bug reports
Track issues and suggest improvements
See Real Success Stories
Developers around the world trust Syncfusion’s Essential Studio to simplify complex projects and speed up delivery. With a vast library of UI controls, powerful SDKs, and reliable support, Essential Studio helps teams build enterprise-ready applications with confidence.
Read Our Customer StoriesIndustry
Software development
75% Cost reduction
50% Faster development

Industry
Utilities (oil and gas)

450+ hours saved
Streamlined processes and hours of development effort saved.

Advanced, flexible features
Empowered users through robust and versatile functionality.
Industry
Software and technology
1000+ of hours saved
Accelerated development with enterprise-ready UI components.

Efficient file management
Streamlined workflows with document libraries without building them from scratch.
Industry
Software and technology

2 Years of delay avoided
Two years of delays prevented with proactive planning.

On-time delivery
Projects delivered on schedule using trusted controls.
Industry
IT services and IT consulting

Improved performance
Large datasets handled with easy customization and quick debugging.

Highly customizable
Plug-and-play controls with quick template integration.
Industry
Professional services
Instant access
Quick availability of features and resources.
Reduced dependencies
Fewer dependencies for faster development.
Awards
Greatness—it’s one thing to say you have it, but it means more when others recognize it. Syncfusion® is proud to hold the following industry awards.