


Explore React Charts Labels, Legends, and Annotations
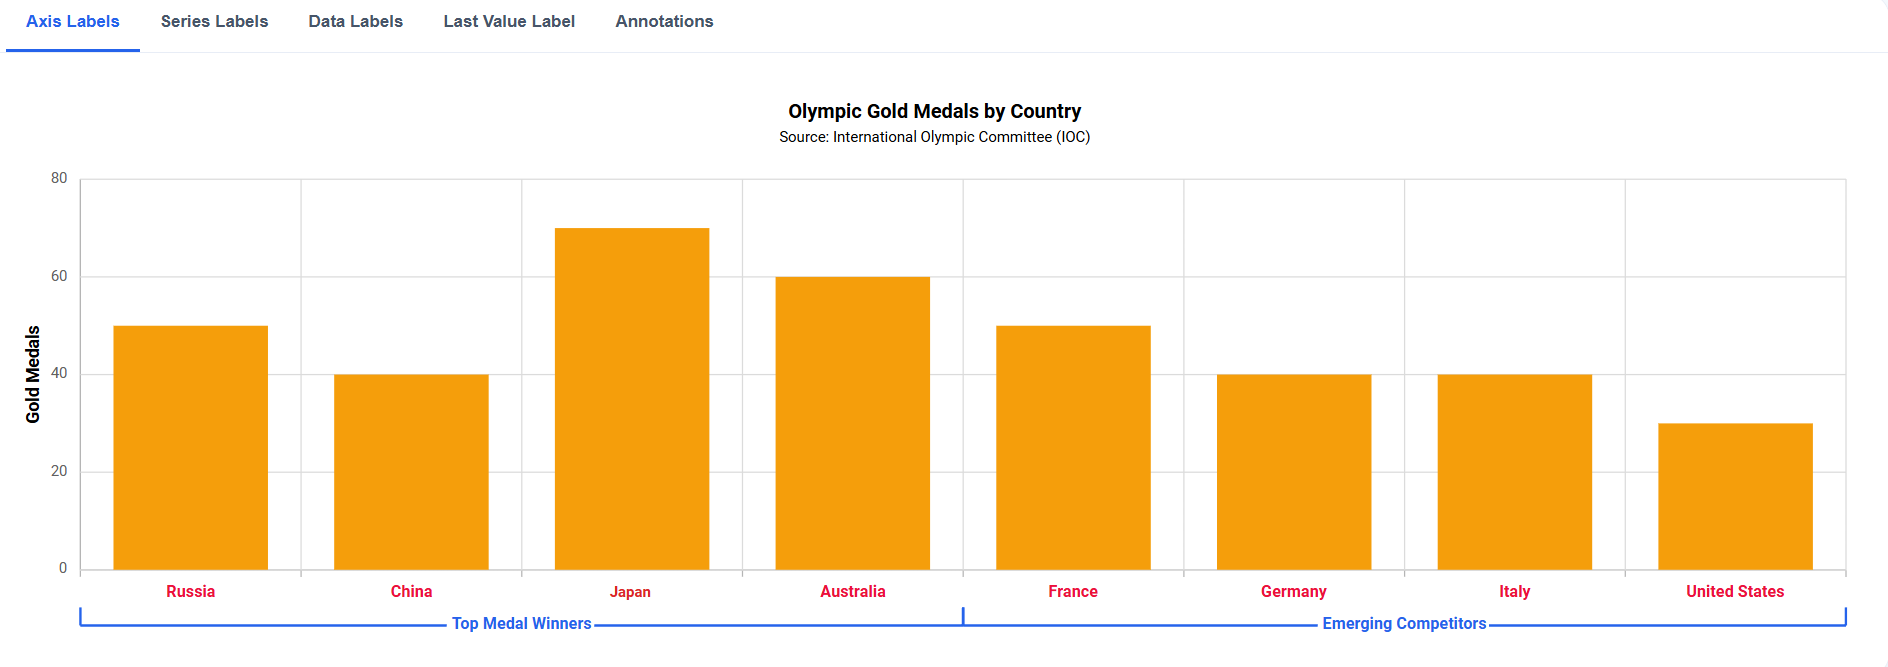
Add context to chart data using axis labels, data labels, series labels, legends, and annotations. These features help users understand values and relationships more easily while improving readability in dense visualizations. Use them when building dashboards, analytical reports, and data-driven applications.
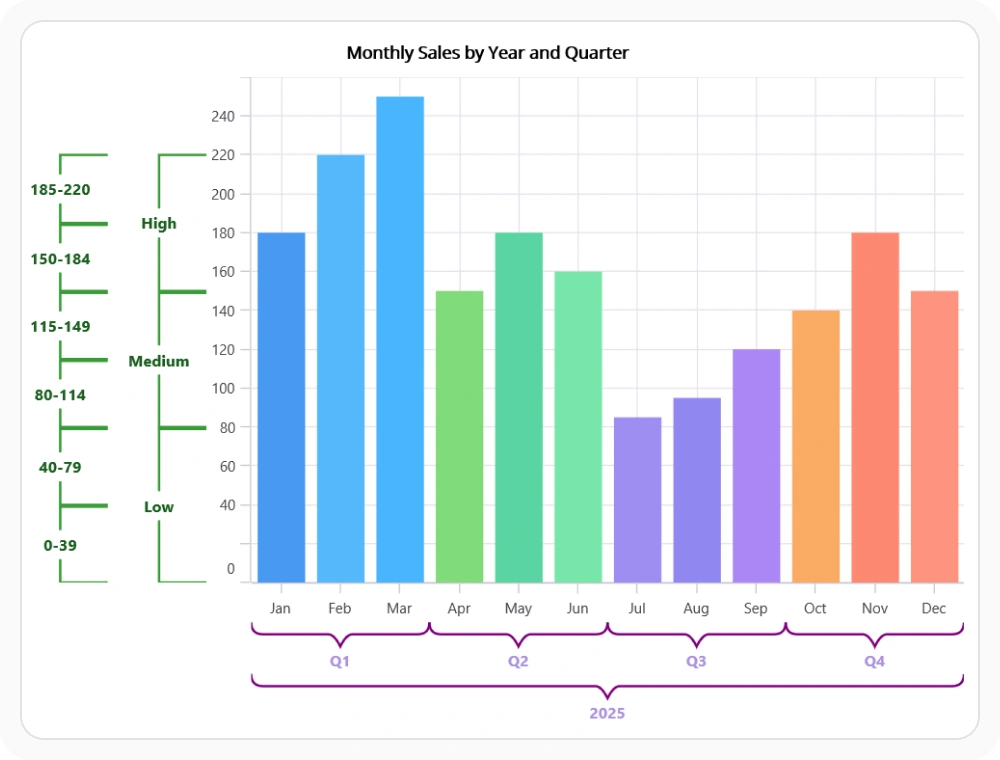
Axis labels with collision management
Display category, numeric, and date labels across dense datasets and compact layouts. Automatic positioning and collision-handling options help prevent overlapping labels and maintain readability. Use this when charts must display many axis values within limited space.
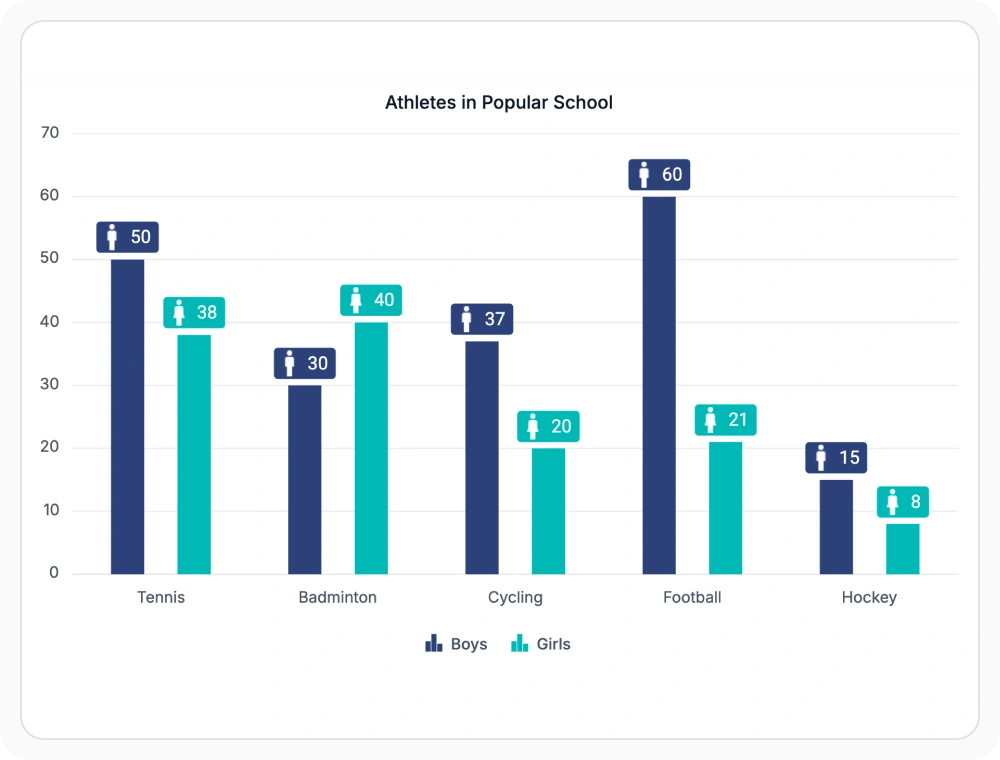
Data labels for exact values
Display values directly within the chart series without relying on tooltips or axis references. Position and customize labels to maintain readability and visual consistency. Use this when users need exact values without hovering over data points.
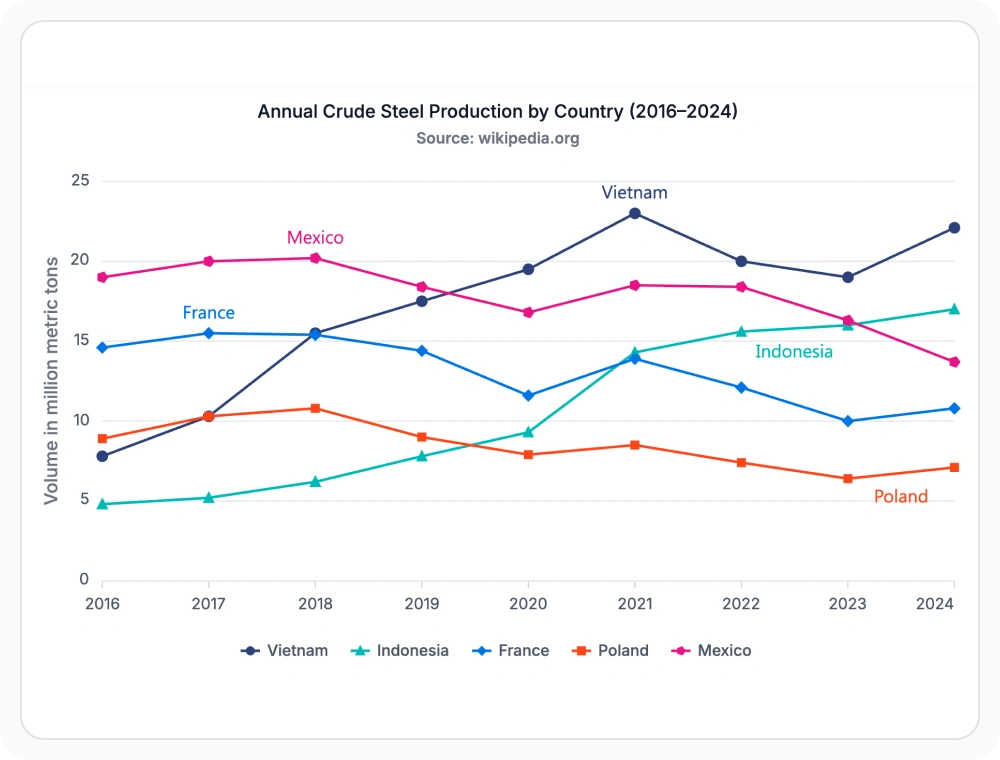
Identify data with series labels
Display series names directly within the chart to help users quickly associate data with the correct series. This improves chart comprehension and reduces the need to cross-reference legends. Use this when charts contain multiple series, closely plotted data, or limited space for legends.
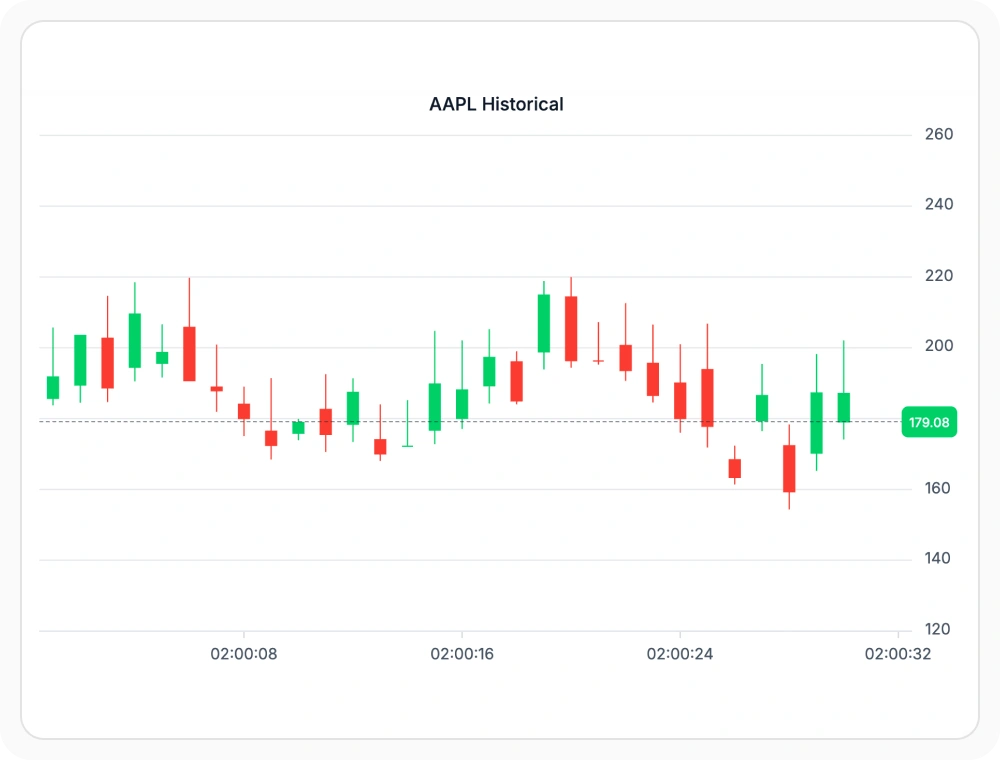
Highlight the latest series value
Display the most recent data point prominently so viewers can identify the current metric value without scanning the entire series. Last-value labels remain visible as new data is added. Use this for charts that continuously receive new data.
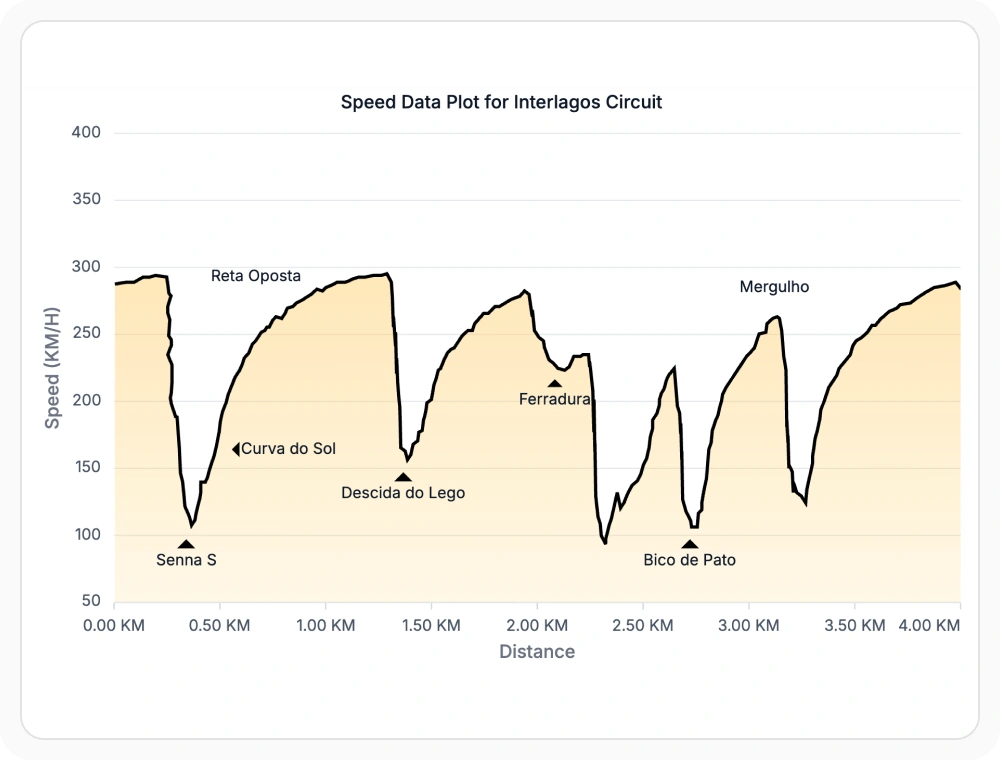
Add context with chart annotations
Place custom content within the chart to explain trends, mark events, or emphasize important details. Annotations connect supporting information to specific chart locations. Use this when charts need callouts or explanations beyond the displayed values.
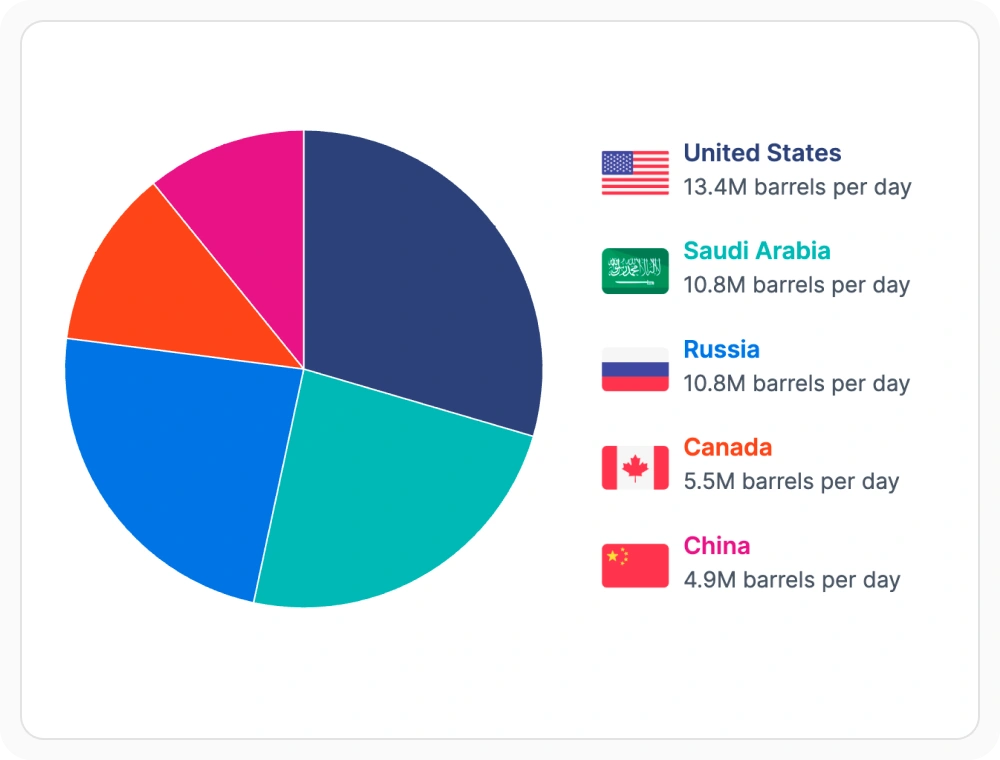
Label chart series with legends
Legends match colors, symbols, or patterns with their corresponding series, helping viewers follow charts without direct labels. Legends also support click and hover interactions for quickly identifying or focusing on specific series. Use this when each series needs a consistent reference outside the chart area.
See Why Developers Love Syncfusion
Our Customers Love Us
Having an excellent set of tools and a great support team, Syncfusion reduces customers’ development time. Here are some of their experiences.




Frequently Asked Questions
What is the difference between a series label and a data label in React Charts?
Series labels identify an entire series once, typically placed near the plotted data. Data labels display the value of each individual data point, shown at or near each mark on the chart.
Can React Charts annotations be positioned using chart data values?
Yes. Set coordinate units to Point and provide X and Y values based on the chart axis scale. Annotations automatically reposition when the axis range changes.
Does React Charts last value label work with all series types?
Last value labels are supported in series types that contain a clearly defined final data point, including line, area, column, and candlestick charts.
Can React Charts axis labels be customized individually?
Yes. Use the axis label render event to customize individual labels dynamically based on position or value, applying different styles or content to specific labels.
How do React Charts series labels improve chart readability?
React Charts series labels display the series name directly near the corresponding data, making it easier for users to identify series without repeatedly referring to the legend.
Can the React Charts legend show custom HTML content?
Yes. Use the template property of legend settings with the legend render event to render custom HTML, icons, or multi-line content for each series.
Resources
Learn more about our React Charts
Explore demos, KB articles, and documentation to get the most out of our React Charts.
Explore guides, APIs, and quick-start tips
Find solutions and best practices fast
See live use cases in action
Get expert help when you need it
Ask, share, and connect with peers
Feature requests and bug reports
Track issues and suggest improvements
See Real Success Stories
Developers around the world trust Syncfusion’s Essential Studio to simplify complex projects and speed up delivery. With a vast library of UI controls, powerful SDKs, and reliable support, Essential Studio helps teams build enterprise-ready applications with confidence.
Read Our Customer StoriesIndustry
Software development
75% Cost reduction
50% Faster development

Industry
Utilities (oil and gas)

450+ hours saved
Streamlined processes and hours of development effort saved.

Advanced, flexible features
Empowered users through robust and versatile functionality.
Industry
Software and technology
1000+ of hours saved
Accelerated development with enterprise-ready UI components.

Efficient file management
Streamlined workflows with document libraries without building them from scratch.
Industry
Software and technology

2 Years of delay avoided
Two years of delays prevented with proactive planning.

On-time delivery
Projects delivered on schedule using trusted controls.
Industry
IT services and IT consulting

Improved performance
Large datasets handled with easy customization and quick debugging.

Highly customizable
Plug-and-play controls with quick template integration.
Industry
Professional services
Instant access
Quick availability of features and resources.
Reduced dependencies
Fewer dependencies for faster development.
Awards
Greatness—it’s one thing to say you have it, but it means more when others recognize it. Syncfusion® is proud to hold the following industry awards.