

Explore React Charts axis types
Configure numeric, date-time, date-time category, category, logarithmic, and multiple axes for different data structures. Suitable for presenting continuous, time-based, categorical, and differently scaled data within chart visualizations.
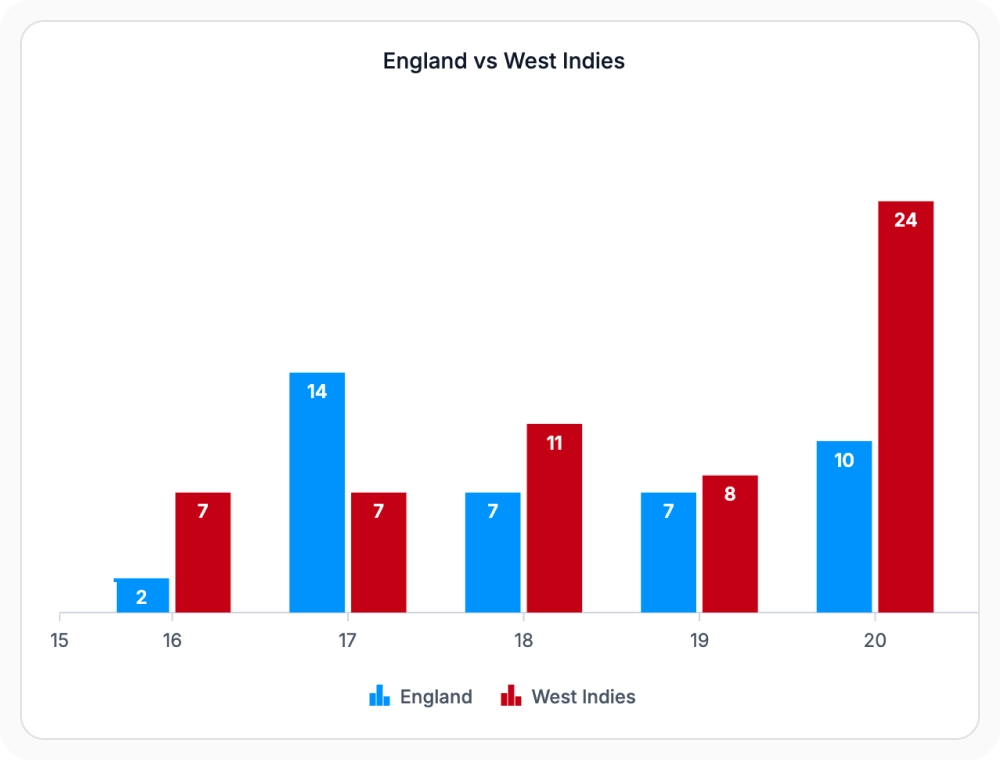
Visualize continuous values with precision
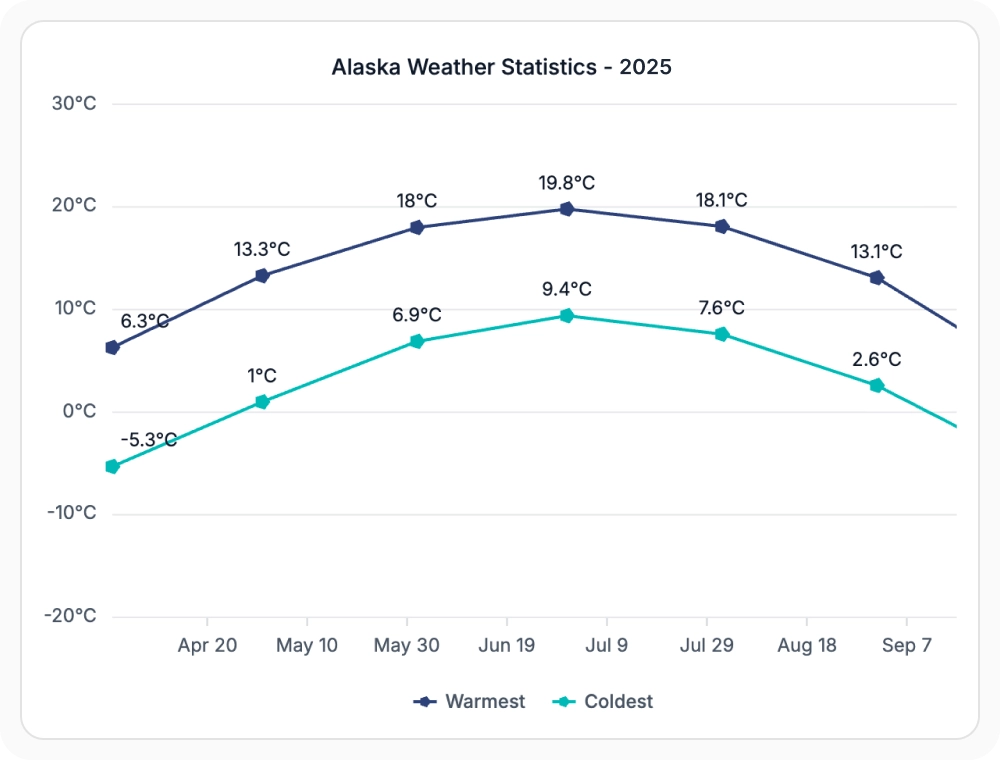
Numeric axes display continuous values such as revenue, measurements, scores, and sales metrics. Suitable for comparing precise values and variations across a continuous scale.
Track data changes over time
Date-time axes plot data points according to their associated dates or times while preserving chronological order. Suitable for analyzing changes, patterns, and trends across time-based data.
Visualize date-time data without gaps
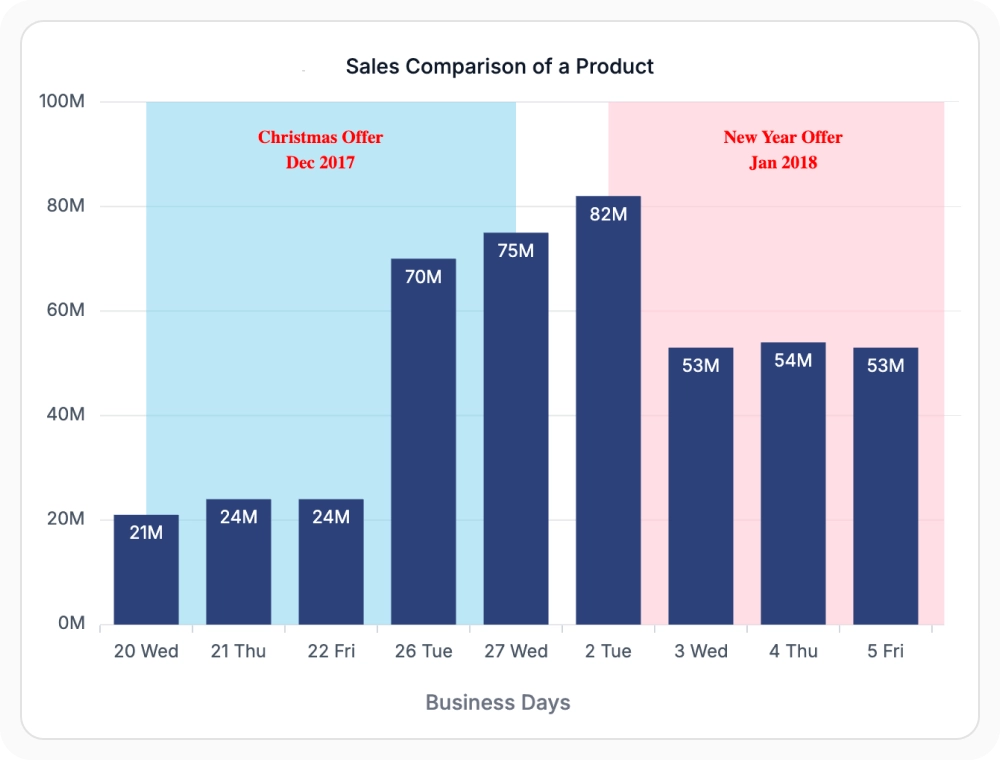
Date-time category axes arrange dates in chronological order while displaying data points with equal spacing. Suitable for analyzing non-continuous time-based data where sequence is more important than the elapsed duration between values.
Compare categories with greater clarity
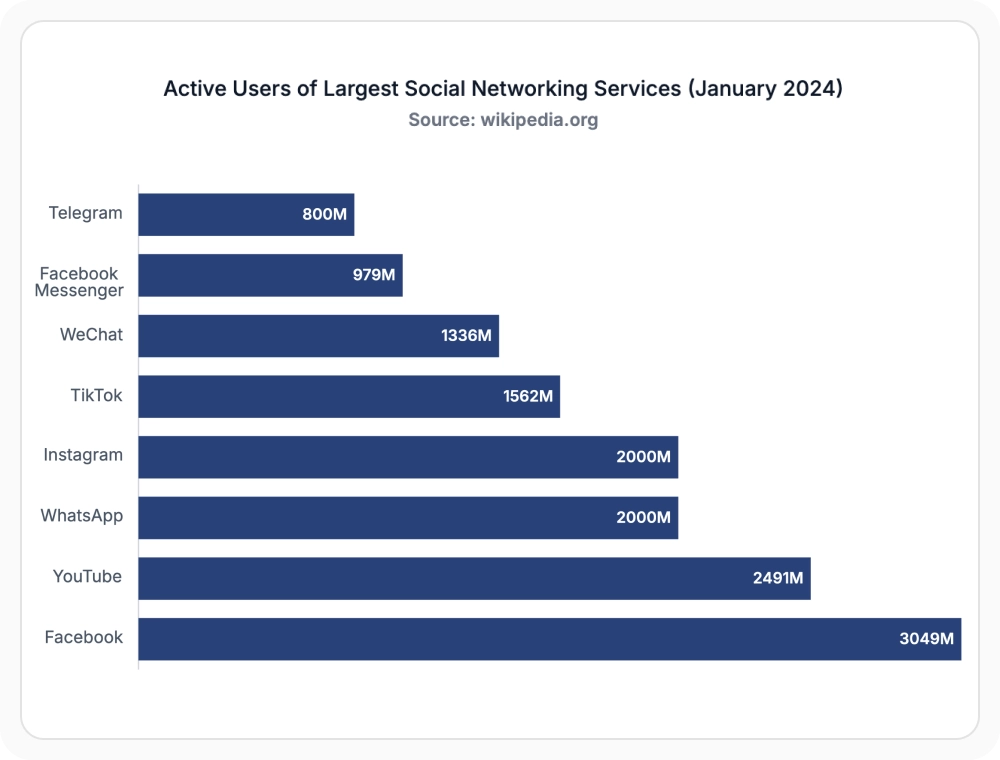
Category axes help compare products, regions, departments, and other groups. Suitable for presenting and comparing data organized into distinct categories.
Visualize large ranges more effectively
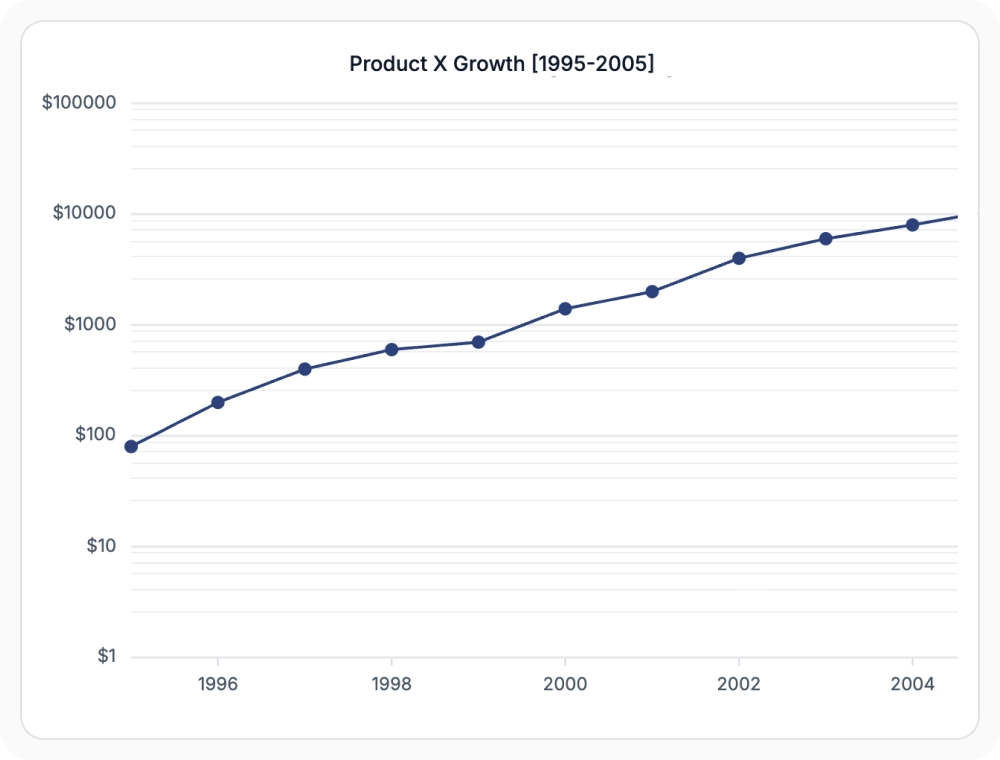
Logarithmic axes display data using a logarithmic scale to compare values that differ significantly in magnitude. Suitable for analyzing datasets that span multiple orders of magnitude and contain widely varying values.
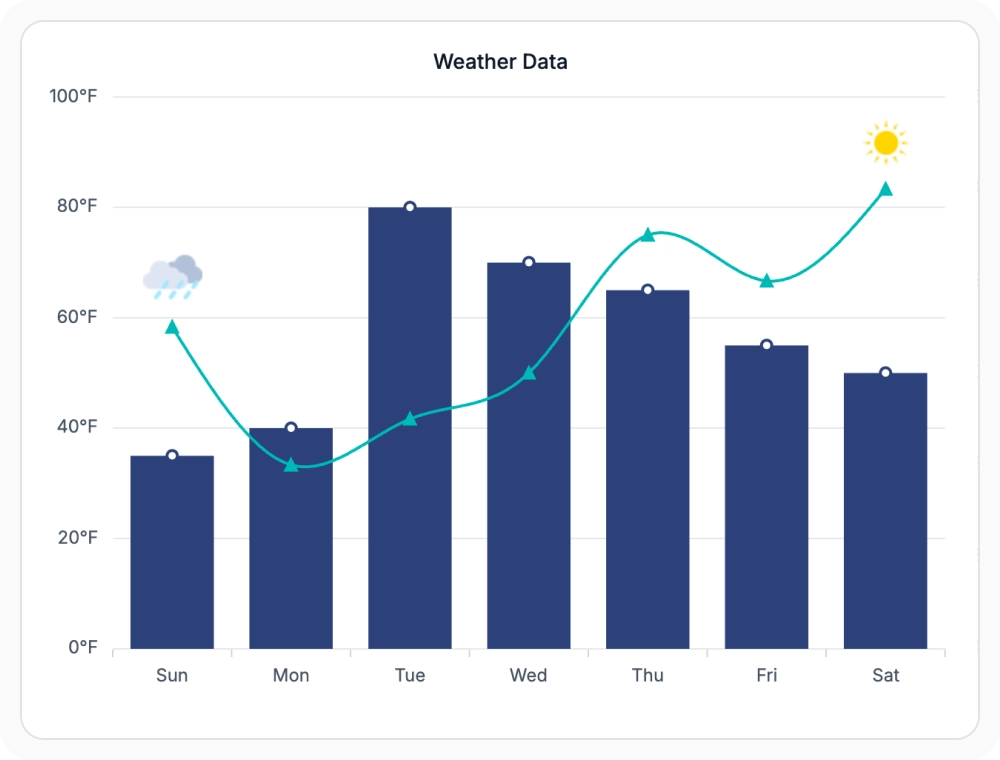
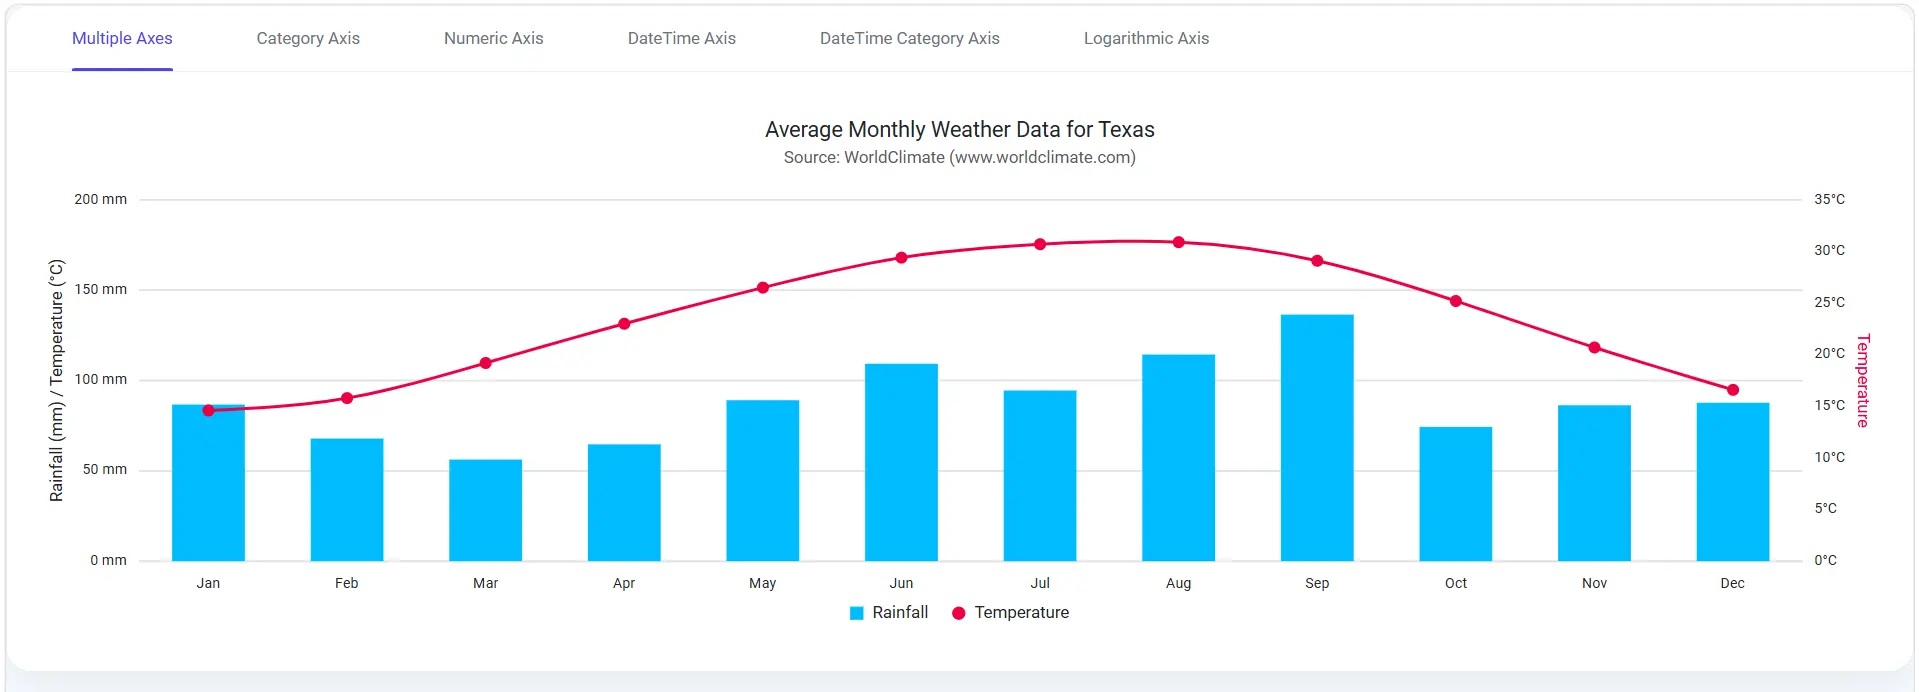
Combine multiple datasets at different scales
Multiple axes allow different series to use separate scales and measurement units within the same chart. Suitable for comparing related datasets that require independent scaling or different units of measurement.
See Why Developers Love Syncfusion
Our Customers Love Us
Having an excellent set of tools and a great support team, Syncfusion reduces customers’ development time. Here are some of their experiences.




Frequently Asked Questions
Which Syncfusion React Charts axis type works best for time-series data?
The date-time axis is the right choice among React Charts axis types when each data point is associated with an exact time. It maintains consistent spacing between dates, even when no value exists for a particular date.
Can Syncfusion React Charts display multiple axes in a single visualization?
Yes. Multiple x-axes and y-axes are supported, allowing series with different units or scales to coexist in the same chart while maintaining independent scaling and formatting for each axis.
Are axis labels, intervals, and gridlines customizable in Syncfusion React Charts?
Yes. Labels, intervals, number formats, tick lines, and gridlines can be customized per axis, and individual elements like gridlines can be hidden while the axis continues to control chart scaling.
How does the date-time category axis differ from the date-time axis in Syncfusion React Charts?
The date-time category axis spaces dates evenly without gaps for missing dates, while the date-time axis inserts gaps for periods with no data. Use the date-time category axis when dates should appear uniformly spaced.
When is a logarithmic axis useful in Syncfusion React Charts visualizations?
Use a logarithmic axis when data spans several orders of magnitude and values vary widely. This scale makes both small and large values easy to interpret without one compressing the other.
Can different series within a chart use separate axes in Syncfusion React Charts?
Yes. Individual series can be bound to a specific x-axis or y-axis, allowing one chart to combine series with different units or magnitudes.
Resources
Learn more about Syncfusion React Charts
Explore demos, KB articles, and documentation to get the most out of the Syncfusion React Charts.
Explore guides, APIs, and quick-start tips
Find solutions and best practices fast
See live use cases in action
Get expert help when you need it
Ask, share, and connect with peers
Feature requests and bug reports
Track issues and suggest improvements
See Real Success Stories
Developers around the world trust Syncfusion’s Essential Studio to simplify complex projects and speed up delivery. With a vast library of UI controls, powerful SDKs, and reliable support, Essential Studio helps teams build enterprise-ready applications with confidence.
Read Our Customer StoriesIndustry
Software development
75% Cost reduction
50% Faster development

Industry
Utilities (oil and gas)

450+ hours saved
Streamlined processes and hours of development effort saved.

Advanced, flexible features
Empowered users through robust and versatile functionality.
Industry
Software and technology
1000+ of hours saved
Accelerated development with enterprise-ready UI components.

Efficient file management
Streamlined workflows with document libraries without building them from scratch.
Industry
Software and technology

2 Years of delay avoided
Two years of delays prevented with proactive planning.

On-time delivery
Projects delivered on schedule using trusted controls.
Industry
IT services and IT consulting

Improved performance
Large datasets handled with easy customization and quick debugging.

Highly customizable
Plug-and-play controls with quick template integration.
Industry
Professional services
Instant access
Quick availability of features and resources.
Reduced dependencies
Fewer dependencies for faster development.
Awards
Greatness—it’s one thing to say you have it, but it means more when others recognize it. Syncfusion® is proud to hold the following industry awards.