




Syncfusion Community License

55+ customizable chart types

Stunning, built-in themes
Introduction
Founded in 2000, InfoChoice Technology Ltda. offers a wide range of IT services, including creative consulting, project management, AI-powered automation, and more. By helping businesses identify opportunities for growth and innovation, InfoChoice delivers tailored technology solutions that improve operational efficiency and drive success.
Problem Summary
InfoChoice struggled to develop data-intensive applications that rely heavily on data grids, visualizations, and other interactive elements. CEO Marconi Vieira and his team often built UI components from scratch and integrated controls from multiple third-party libraries, which increased development complexity, prolonged project timelines, and caused inconsistent user experiences.
“I would describe Syncfusion as a comprehensive and reliable UI component suite that can greatly accelerate development, especially for enterprise and data-intensive applications. It is particularly valuable when time-to-market and consistency are critical.”
– Marconi Vieira, CEO
BEFORE SYNCFUSION
Challenges
- Juggling multiple third-party libraries increased project complexity.
- Building high-quality UI components required substantial development effort.
- Designing interactive, data-driven interfaces took longer than desired.
- Providing a consistent user experience across components was difficult.
AFTER SYNCFUSION
Solutions
- Simplified development workflows by adopting Syncfusion.
- Integrated Syncfusion’s prebuilt, enterprise-grade ASP.NET Core DataGrid and Charts components.
- Accelerated project delivery with ready-to-use UI components.
- Elevated user experience with standardized Syncfusion components.
Implementation
InfoChoice gradually integrated Syncfusion into its UI development workflows. “It was evaluated and tested in a focused development context, with a small team exploring components, validating integration, and assessing its fit for real-world applications and future projects,” Marconi said.
Ultimately, Syncfusion proved to be an invaluable addition to InfoChoice’s technology stack. As Marconi explains, “While this was an evaluation phase, it was clear that Syncfusion can significantly reduce development time for UI components and improve delivery speed in data-driven projects.”
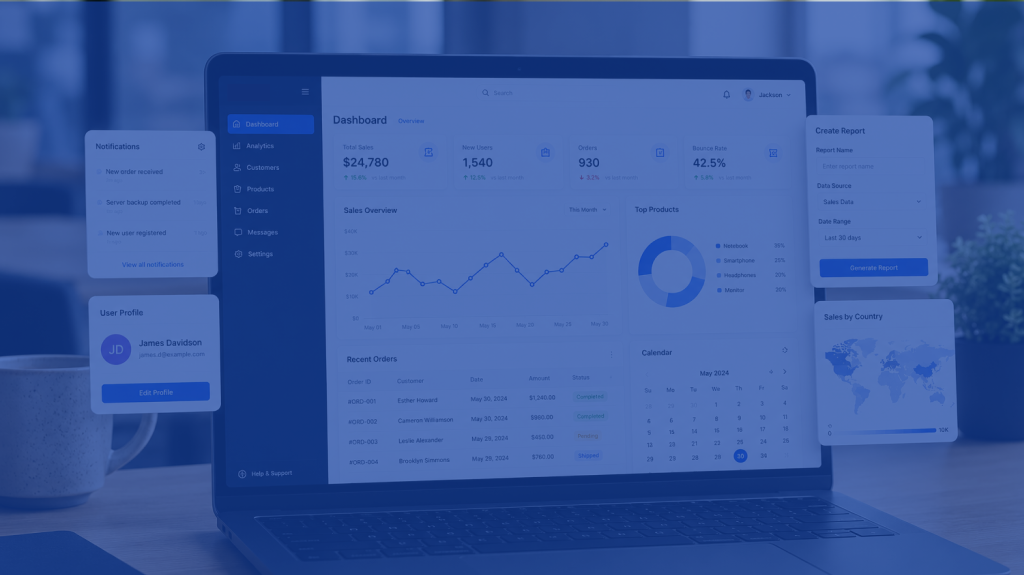
Today, InfoChoice leverages Syncfusion’s ASP.NET Core DataGrid and Charts to streamline UI development for data-intensive applications. “Syncfusion is used as a UI acceleration layer within development workflows,” Marconi said. “It supports developers in building data-centric interfaces, such as dashboards and analytical views, helping transform raw data into actionable insights.”
Results
- Accessed robust, ready-made UI components at no cost.
- Consolidated third-party tools by adopting a feature-rich UI component suite.
- Successfully supported real-world UI development workflows.
- Rapidly designed enterprise-level applications with data-centric interfaces.
- Simplified data management by structuring data in a tabular format.
- Transformed complex, raw data into clear, actionable analytics.
- Standardized UI components, creating a more stable user experience.
Future Plans
While no explicit plans have been established, InfoChoice may expand its usage of Syncfusion as future needs arise. “Depending on project requirements, it may be adopted in future solutions where rapid development of data-driven interfaces and dashboards is essential, especially in enterprise or analytics-focused scenarios.”
Conclusion
Using Syncfusion’s ASP.NET Core DataGrid and Charts, InfoChoice streamlined the development of data-intensive applications. By replacing custom-built UI components and disparate libraries with a rich, enterprise-grade UI component suite, InfoChoice can now effortlessly organize and visualize data, deliver high-quality projects faster, and offer a more stable user experience across analytical views and dashboards.
According to CEO Marconi Vieira, “Syncfusion significantly accelerated UI development and improved consistency across components. It reduced the need to build foundational elements from scratch, allowing more focus on business logic and data integration. It also improved the overall quality and reliability of data visualization.”