Skip to content
Blogs
Search blogs
Select Categories
Charts
6 min read
Jan 9, 2026
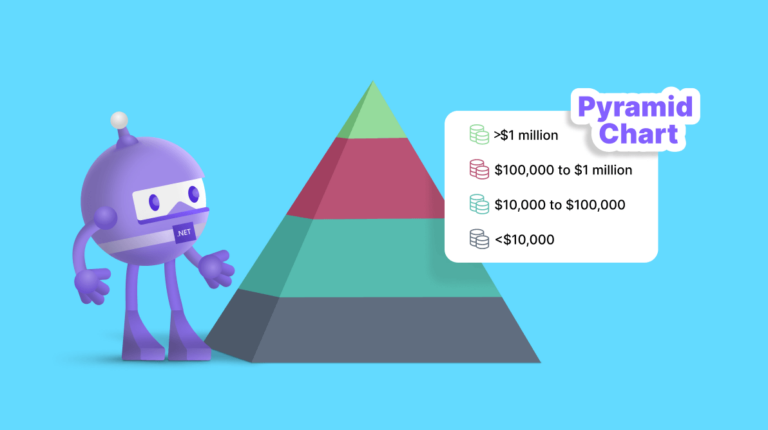
Chart of the Week: Creating a .NET MAUI Pyramid Chart of Global Wealth Distribution
Saiyath Ali Fathima M
11 min read
Apr 22, 2025
What's New in Blazor Charts: 2023 Volume 2
Bhuvanesh Valarman
9 min read
Jan 13, 2025
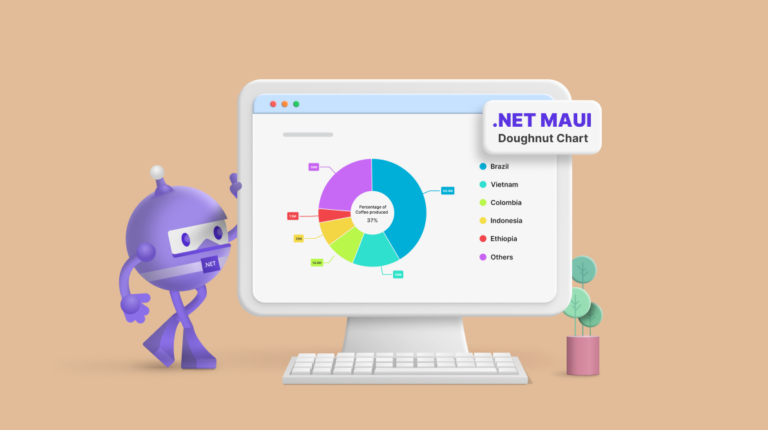
Chart of the Week: Creating a Doughnut Chart for the World's Top Coffee-Producing Countries
Nanthini Mahalingam
8 min read
Jan 15, 2026
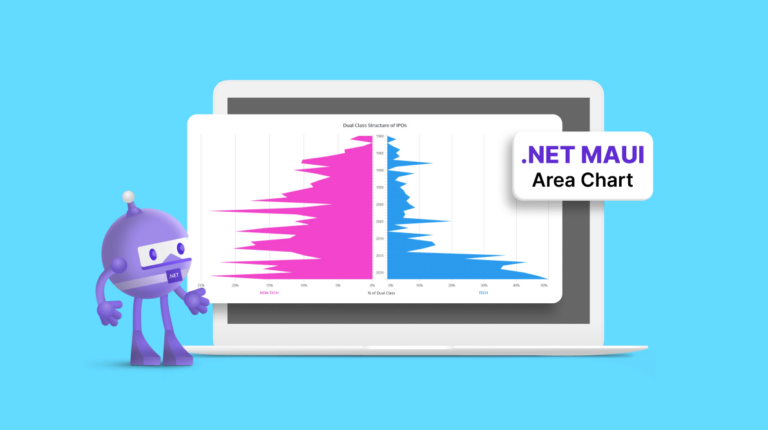
Chart of the Week: Creating .NET MAUI Area Chart for US Tech Companies Adopting Dual-Class Voting Structures
Saiyath Ali Fathima M
8 min read
Jan 19, 2026
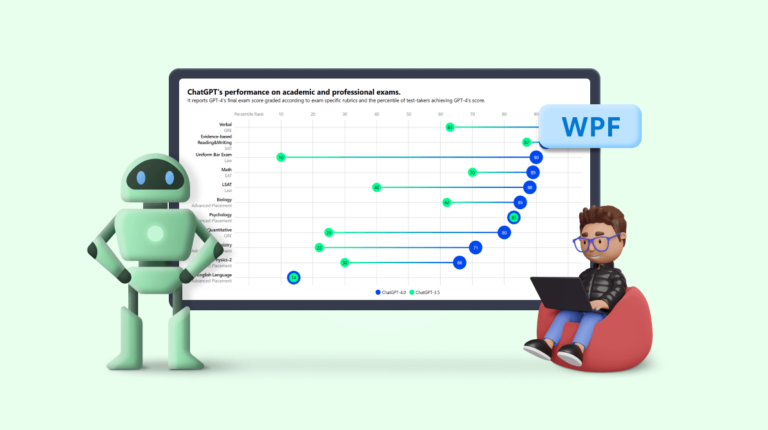
Chart of the Week: Creating a WPF Range Column Chart to Visualize ChatGPT’s Performance in Competitive Exams
Moneeshram Dhanabal
9 min read
Jan 15, 2026
Chart of the Week: Creating a .NET MAUI Multiple-Column Chart to Visualize the Purchase Revenue of US E-Health and Meditation Apps
Vimala Thirumalai Kumar
7 min read
Jan 15, 2026
Chart of the Week: Creating a .NET MAUI Error Bar Chart to Visualize the Thermal Expansion of Materials
Sowndharya Selladurai
7 min read
Jan 9, 2026
What’s New in 2023 Volume 2: .NET MAUI Charts
Saravanan Madheswaran
6 min read
Jan 9, 2026
Chart of the Week: Creating a .NET MAUI Pie Chart to Illustrate US Methane Emissions in 2021
Vimala Thirumalai Kumar
1
…
10
11
12
13
14
15
16
…
18
1
…
12
13
14
…
18
 Saiyath Ali Fathima M

 Bhuvanesh Valarman
 Nanthini Mahalingam
 Moneeshram Dhanabal

 Vimala Thirumalai Kumar

 Sowndharya Selladurai
 Saravanan Madheswaran