Skip to content
Blogs
Search blogs
Select Categories
Charts
8 min read
Jan 9, 2026
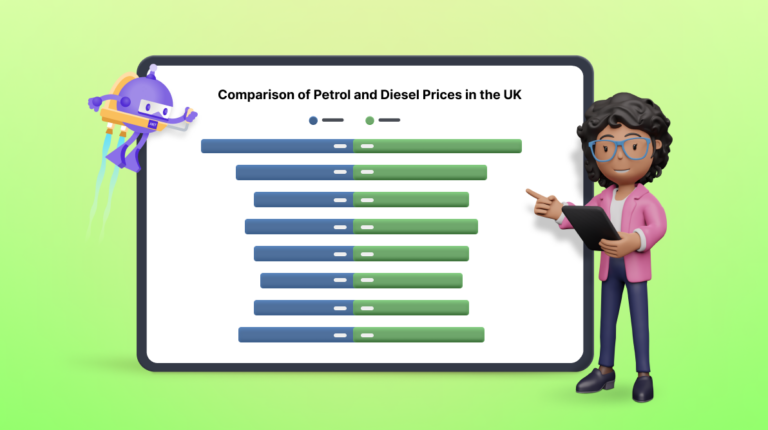
Chart of the Week: Creating a .NET MAUI Tornado Chart for Comparing Petrol and Diesel Prices in the UK
Sowndharya Selladurai
7 min read
Jan 9, 2026
Chart of the Week: Creating a .NET MAUI Radial Bar Chart for the Most and Least Powerful Passports in 2023
Nitheeshkumar Thangaraj
6 min read
Jan 16, 2026
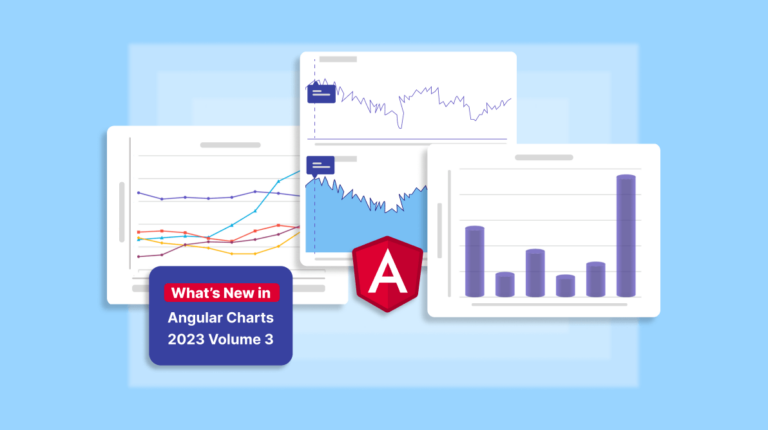
What’s New in Angular Charts: 2023 Volume 3
Sumankumar G
9 min read
Jan 19, 2026
Chart of the Week: Creating a WinUI Stacked Area Chart to Visualize US Primary Energy Consumption
Nanthini Mahalingam
7 min read
Mar 21, 2025
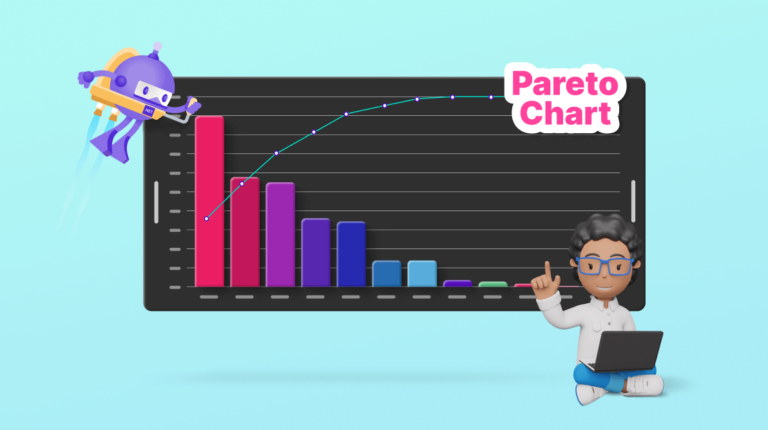
Chart of the Week: Creating a Pareto Chart Using .NET MAUI Charts to Identify Key Customer Complaints
Saravanan Madheswaran
7 min read
Jan 19, 2026
Chart of the Week: Creating a WPF Doughnut Chart for the Top Rice-Exporting Countries
Saiyath Ali Fathima M
8 min read
Jan 15, 2026
Chart of the Week: Creating a .NET MAUI Horizontal Bar Chart to Compare Grocery Prices Between Two Countries
Sowndharya Selladurai
11 min read
Apr 22, 2025
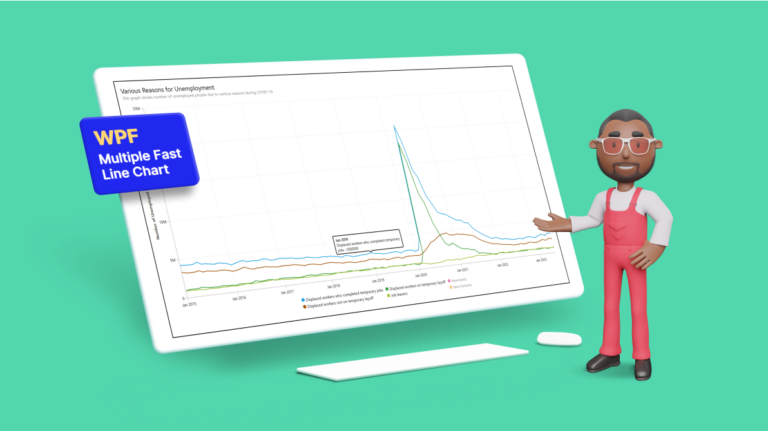
Chart of the Week: Creating a WPF Multiple Fast Line Chart to Display COVID-19's Impact on U.S. Unemployment
Moneeshram Dhanabal
5 min read
Jan 15, 2026
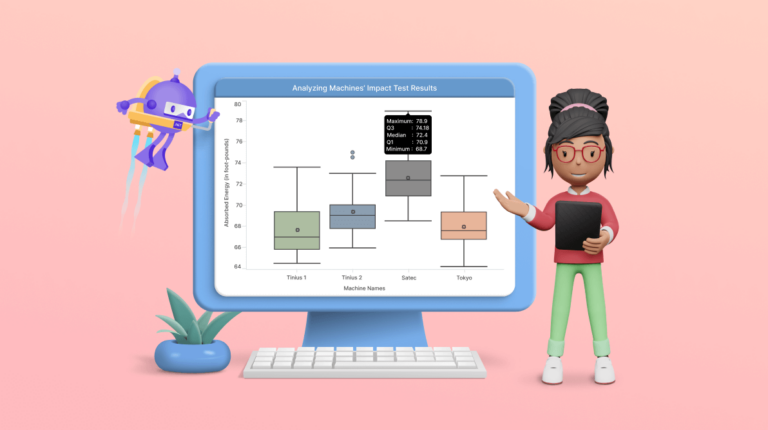
Chart of the Week: Creating a .NET MAUI Box and Whisker Chart for Machine Impact Test Analysis
Sowndharya Selladurai
1
…
9
10
11
12
13
14
15
…
18
1
…
11
12
13
…
18
 Sowndharya Selladurai

 Nitheeshkumar Thangaraj
 Sumankumar G

 Nanthini Mahalingam
 Saravanan Madheswaran
 Saiyath Ali Fathima M
 Moneeshram Dhanabal