
PHP Sparkline Control
- A perfect toolkit to display the trends in a very small area.
- Place the sparkline in a data grid cell to visualize a group of data.
- Customize the sparkline completely by changing the series or axis type and by adding markers, data labels, range band, etc.
Trusted by the world’s leading companies

Overview
The PHP Sparkline charts control, which is also known as inline graph or tiny charts is a data visualization tool that helps represent trends and variations associated with a measurement—such as average temperature or stock market activity—in a simple, lightweight, and condensed manner. This is a toolkit to display data when there is space constraints, for example, viewing on the mobile device, placing inside a grid cell, etc.
Sparkline types
The PHP Sparkline charts control supports five types of sparklines (line, column, area, win-loss, and pie) to show the data trends.
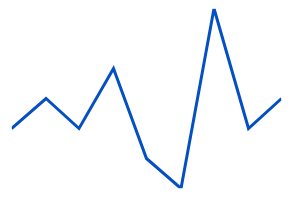
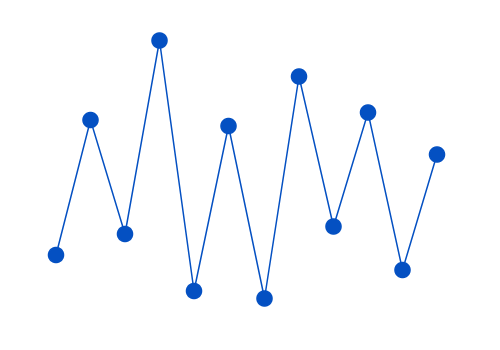
Line sparkline
Use line sparkline to represent patterns and trends in data, such as seasonal effects, large changes, and turning points over a period of time.
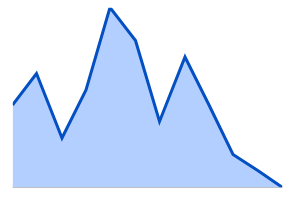
Area sparkline
An area sparkline is a line sparkline with the area between its points colored. Use this when the magnitude of the trend is to be communicated rather than individual data values.
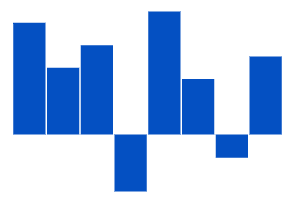
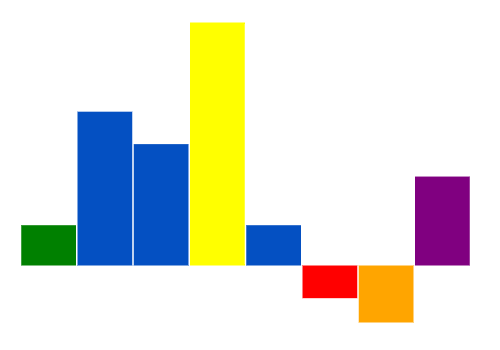
Column sparkline
Show different values of two or more subjects using column sparkline; use vertical bars to represent different values.

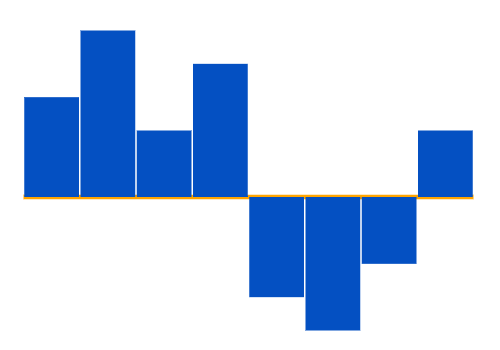
Win-loss sparkline
Use win-loss sparkline to show if each value is positive, negative, or zero to visualize win/loss scenarios such as results in games.
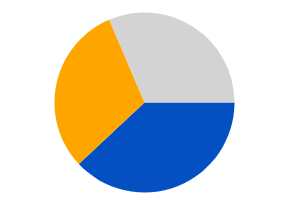
Pie sparkline
A pie sparkline is a circular graph that is divided into slices to illustrate numeric proportions.
Axis customization
Configure and customize axes in the sparkline graphs to show the origin and range of data points.
Special points customization
Denote data usage in PHP Sparkline charts by highlighting and customizing special data points, such as first, last, high, low, and negative points.
Markers
The marker highlights data points in a line and area sparklines and makes these sparklines more readable.
Tooltip
The interactive sparkline charts provide options to display details about data point values through a tooltip when hovering the mouse over a data point.
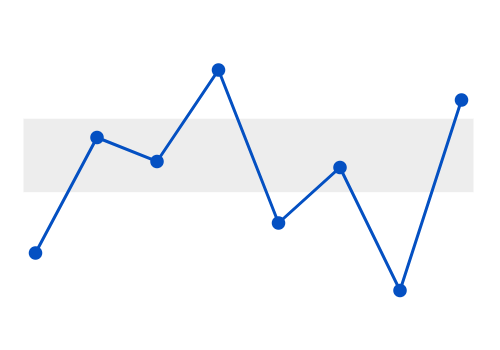
Range band
Highlight a particular region in the PHP Sparkline charts control using range band to show the range of safe values. By setting the minimum and maximum ranges for a range band, the outliers can easily be identified.
Touch and browser support
The interactive Sparkline Control also supports touch interactions.

Touch support
All the sparkline features will work on touch devices with zero configuration. Use the touch features such as tooltip and track line without any customization.

Responsive
You can view the PHP Sparkline charts control on various devices. You can also hide specific elements in a sparkline for particular screen sizes by making minimal changes to the events.

Cross-browser support
You can render Sparkline Control in all the modern browsers.
60+ PHP CONTROLS
ALL CONTROLS
GRIDS
DATA VISUALIZATION
EDITORS
NAVIGATION
NOTIFICATION
BUSINESS INTELLIGENCE
REPORTING
Rated by users across the globe
Syncfusion PHP Resources
Learning
 Documentation
 Documentation


Awards
Greatness—it’s one thing to say you have it, but it means more when others recognize it. Syncfusion® is proud to hold the following industry awards.

