Try Our Live Demo
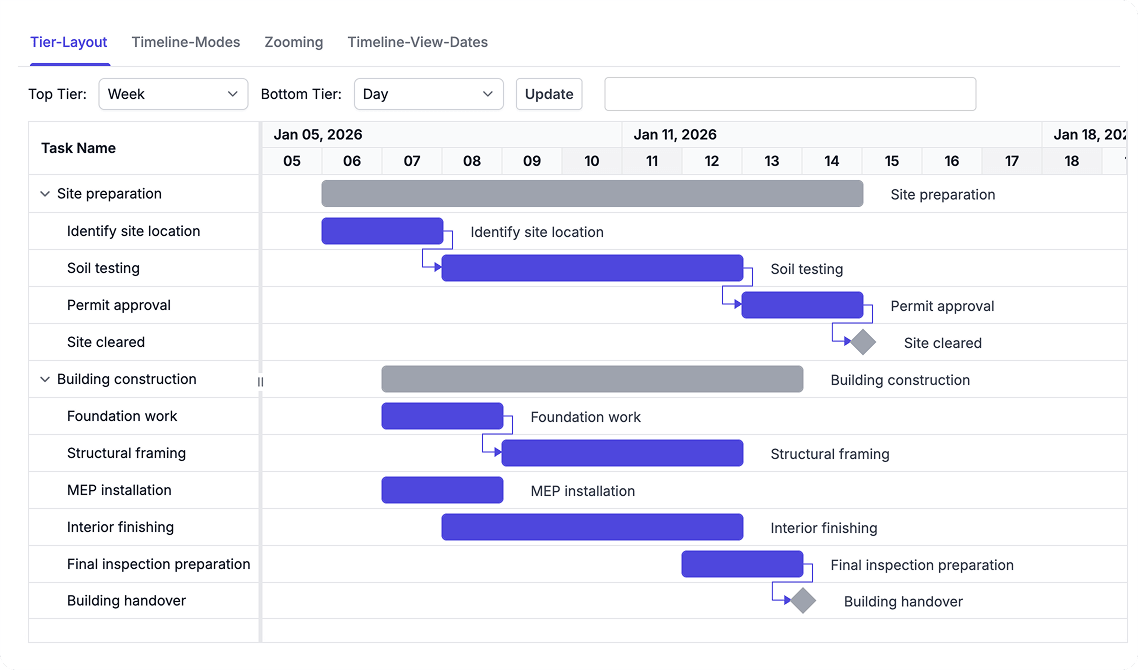
Customize Timeline Views
Configure timeline headers with multiple time-unit levels to display project schedules across minutes, hours, days, weeks, months, or years. Use zooming and date range settings to control the visible timeline and adjust the schedule view for different planning and review scenarios.
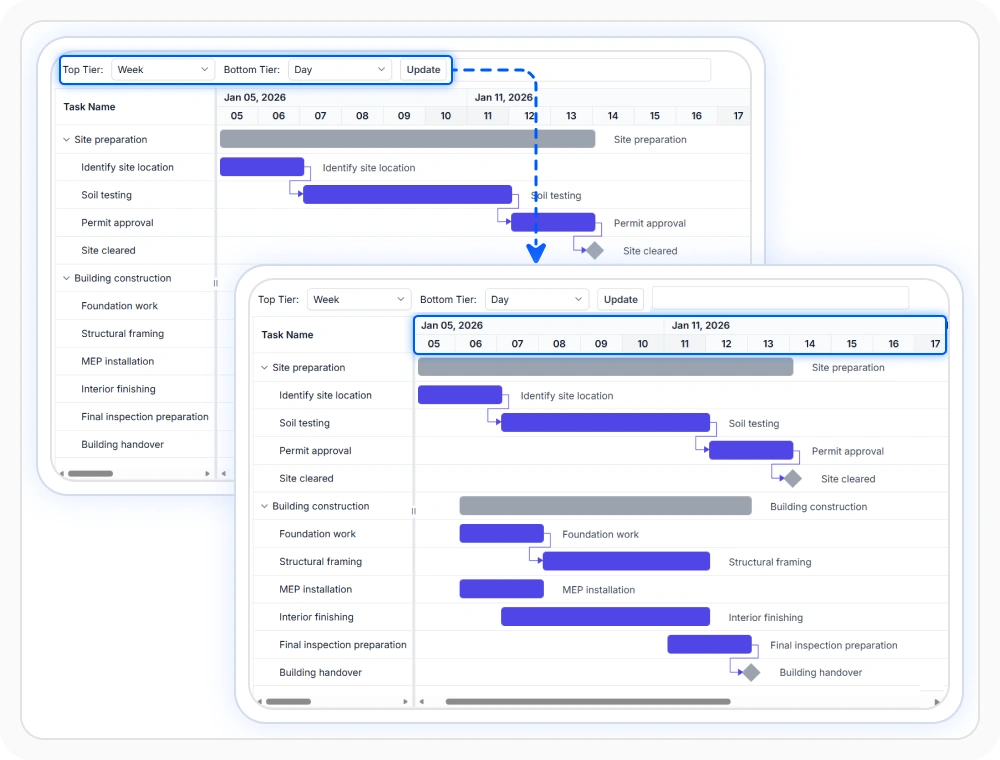
Configure tiered timeline headers
Display multiple time scales such as weeks and months in the same timeline view. This helps project managers maintain strategic context while reviewing detailed task schedules. Use it when projects span multiple planning horizons.
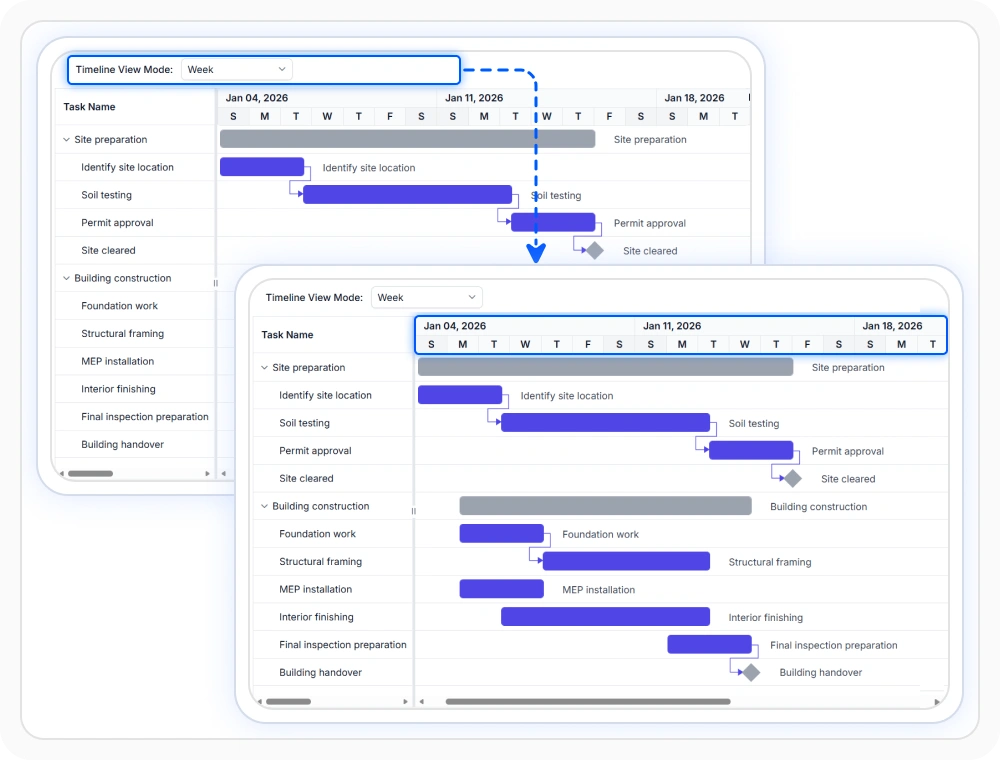
Switch between timeline modes
Timeline modes control how the schedule is displayed across minutes, hours, days, weeks, months, or years. This makes it easier to match the visible timeline to the planning depth needed for the current schedule view. Use them when teams need to switch between short-range tracking and broader schedule overviews.
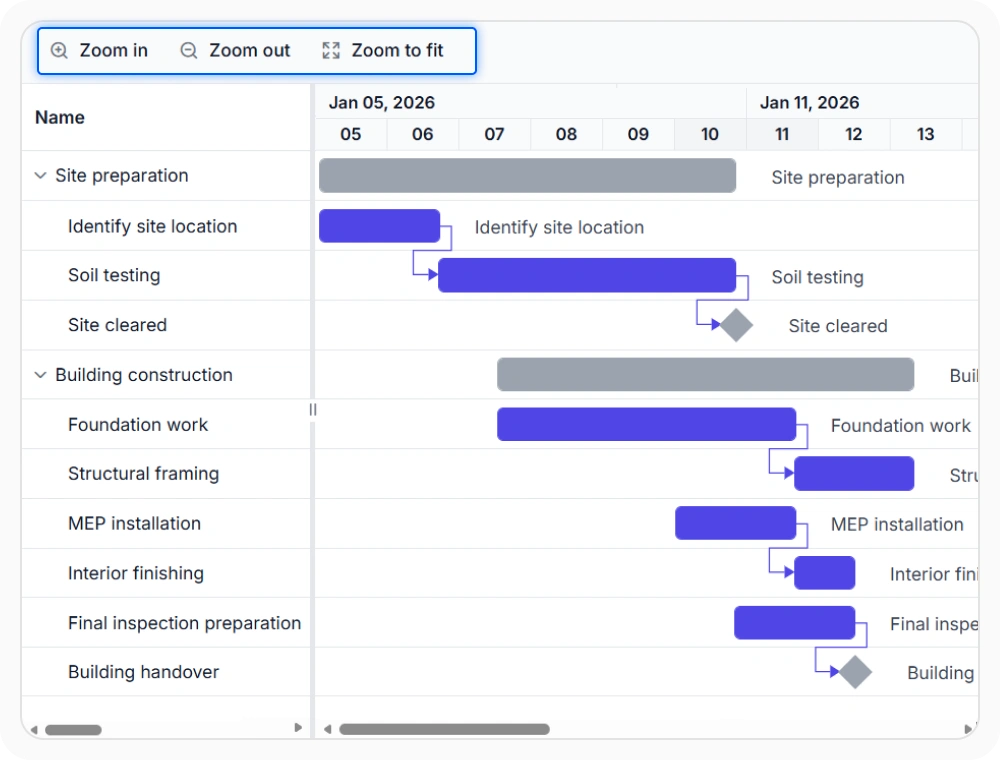
Zoom project timeline views
Zooming adjusts how much timeline detail appears without changing schedule data. This helps teams switch between detailed task views and broader project timelines. Use it when schedule visibility needs to change during analysis or presentation.
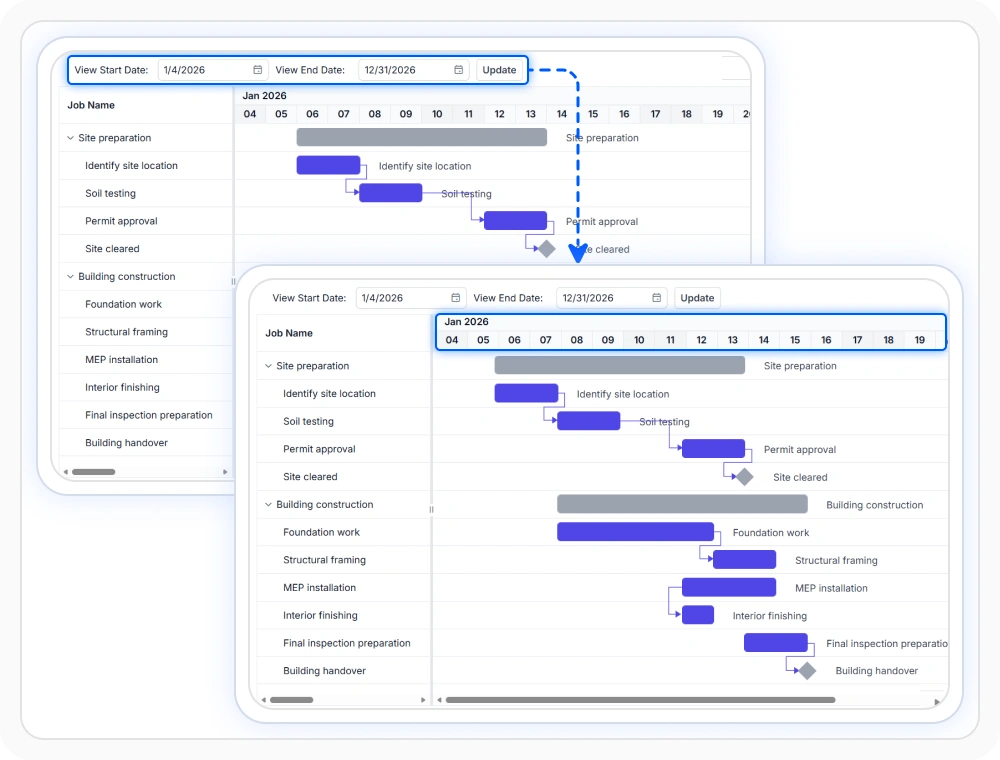
Define fixed timeline ranges
Define a fixed timeline range that determines which part of the schedule is visible in the chart. Schedule visibility stays focused on a selected period without changing project dates. Use this option when teams need a consistent timeline view.
See Why Developers Love Syncfusion
Our Customers Love Us
Having an excellent set of tools and a great support team, Syncfusion reduces customers’ development time. Here are some of their experiences.





Frequently Asked Questions
Can timeline settings be customized dynamically in React Gantt Chart?
Yes. Developers can configure timeline tiers, units, formats, and zoom levels to match project requirements.
How does React Gantt Chart timeline support different planning ranges?
The React Gantt Chart timeline supports multiple date scales, tiered headers, zoom levels, and adjustable timeline ranges. These features help teams manage both short-term tasks and long-term project schedules within the same view.
What are timeline modes in React Gantt Chart?
Timeline modes control the visible time scale in the Gantt Chart, such as minutes, hours, days, weeks, months, or years. This helps present the schedule at the level of detail needed for short-range tracking or broader planning views.
What is the benefit of zooming in React Gantt Chart?
React Gantt Chart zooming changes the visible timeline scale without affecting project data. This makes it easier to switch between detailed task tracking and high-level milestone planning.
What are fixed timeline view ranges in React Gantt Chart?
Fixed timeline view ranges define which part of the schedule remains visible in the chart. They help teams focus on a specific planning period while preserving the full project schedule for calculations and project management activities.
Can React Gantt Chart display multiple timeline tiers?
Yes. React Gantt Chart supports tiered timeline headers that display multiple time scales simultaneously, such as months and weeks or weeks and days. This improves schedule readability while preserving detailed project information.
Resources
Learn more about React Gantt Chart
Explore demos, KB articles, and documentation to get the most out of React Gantt Chart.
Explore guides, APIs, and quick-start tips
See live use cases in action
Ask, share, and connect with peers
Find solutions and best practices fast
Get expert help when needed
Feature requests and bug reports
Track issues and suggest improvements
Awards
Greatness—it’s one thing to say you have it, but it means more when others recognize it. Syncfusion® is proud to hold the following industry awards.