Try Our Live Demo
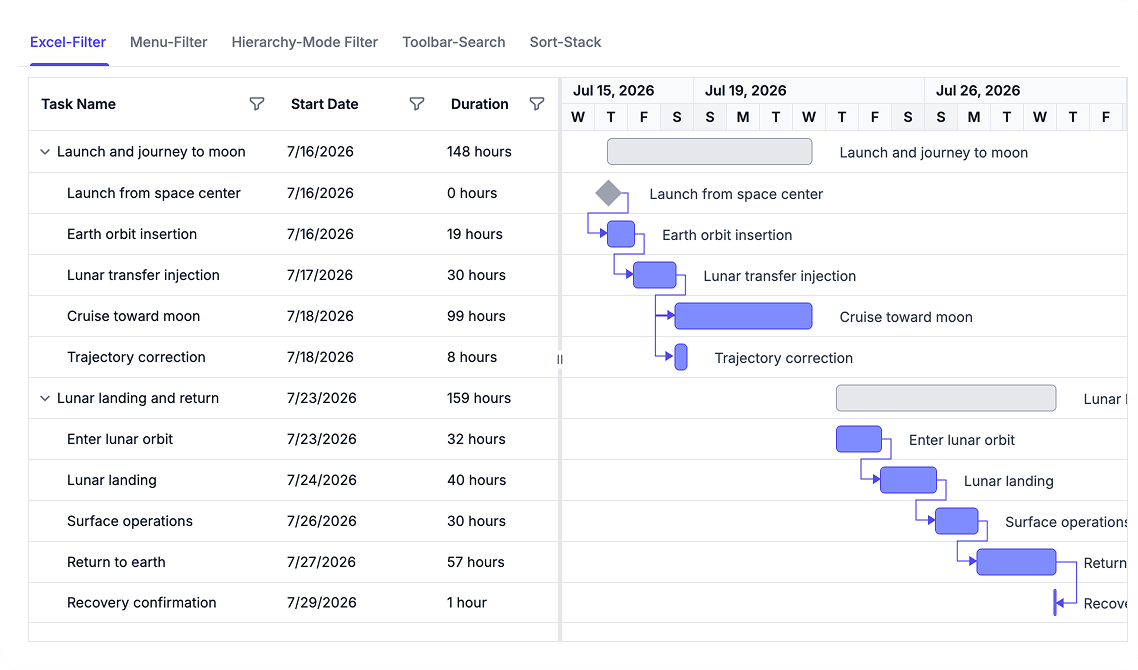
Filter and Sort Project Tasks
Quickly focus on relevant project information using advanced filtering and multi-column sorting and control parent and child task visibility within filtered views.
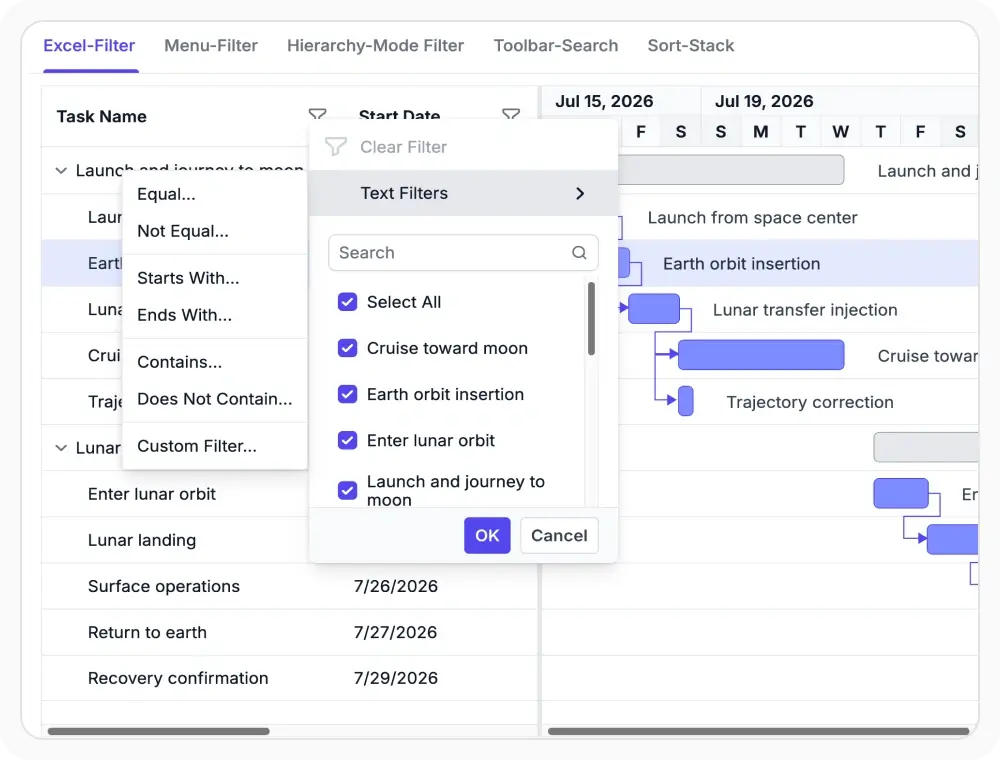
Filter values with Excel-like filtering
Excel-like filtering provides a familiar interface for narrowing tasks using selected values and advanced conditions. This helps teams quickly focus on relevant schedule data. Use it when repeated task values need direct selection or combined criteria.
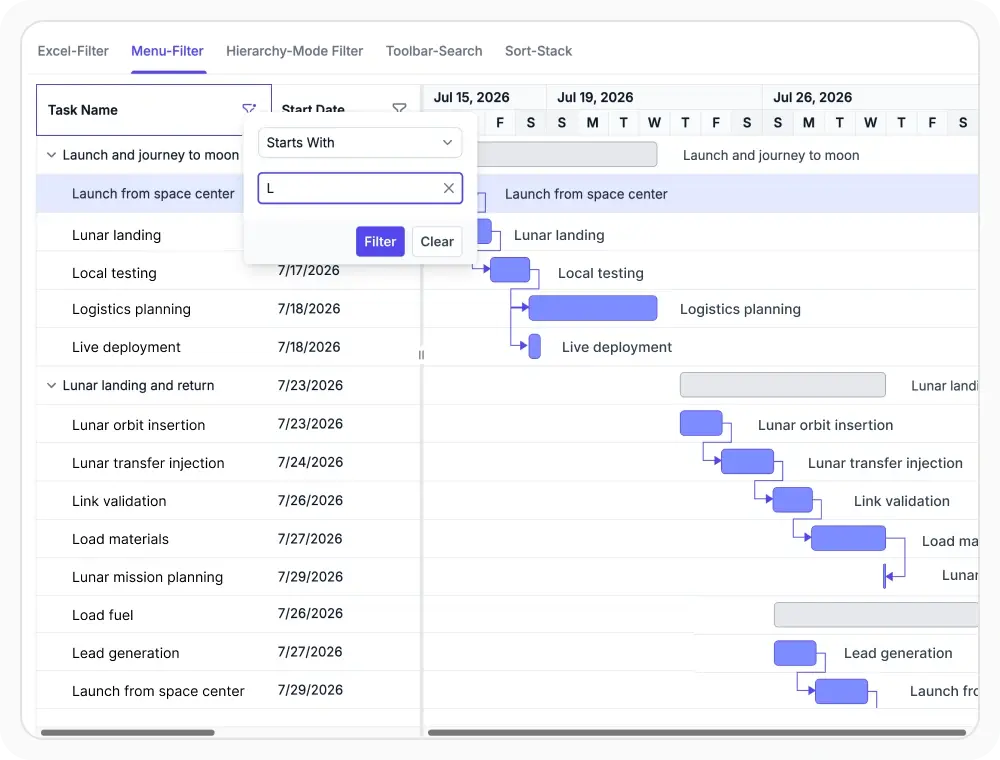
Menu filter for conditions
Menu filtering applies condition-based operators to text, numeric, and date fields. This helps teams refine schedules using precise criteria. Use it when project data requires targeted filtering conditions.
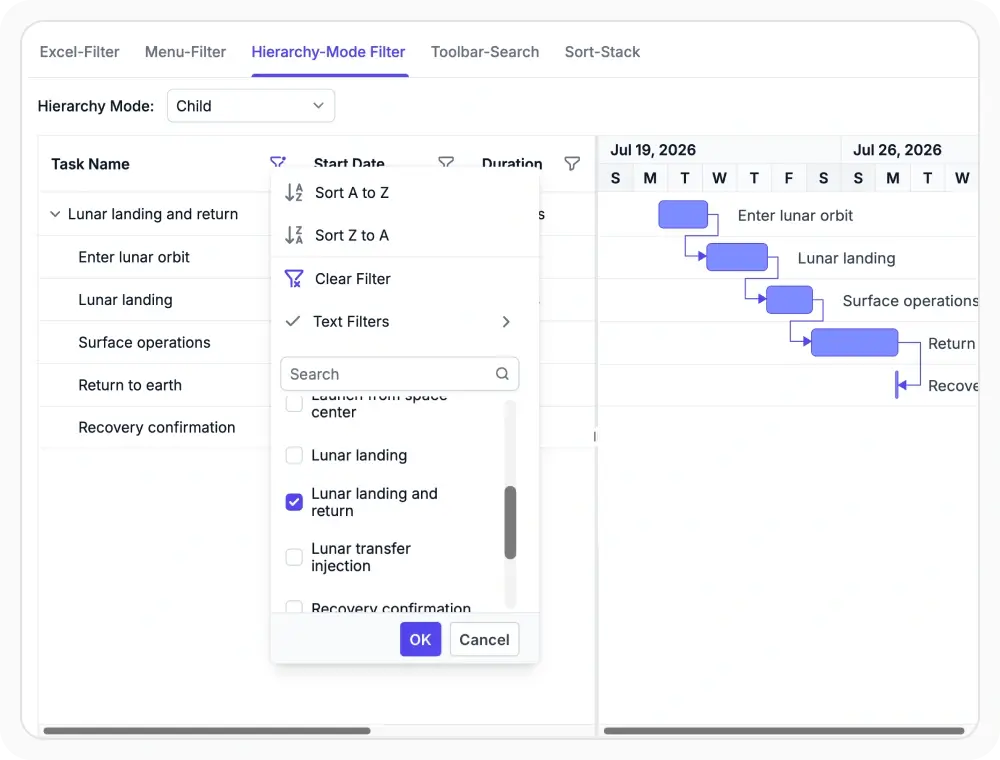
Preserve hierarchy during filtering
Hierarchy filtering controls which related task levels remain visible after filtering. This helps teams maintain project context while refining schedule data. Use it when nested schedules require contextual results.
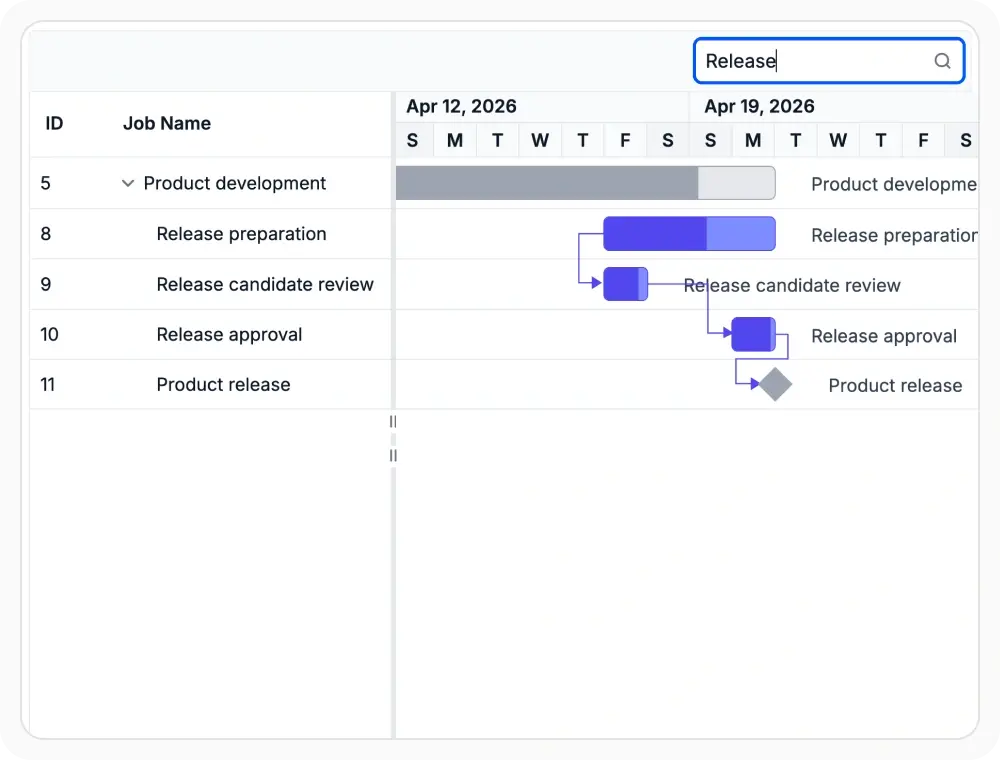
Toolbar search across tasks
Toolbar search finds matching values across schedule data without requiring column-specific filters. This helps teams quickly locate task information. Use it when task details must be found across multiple fields.
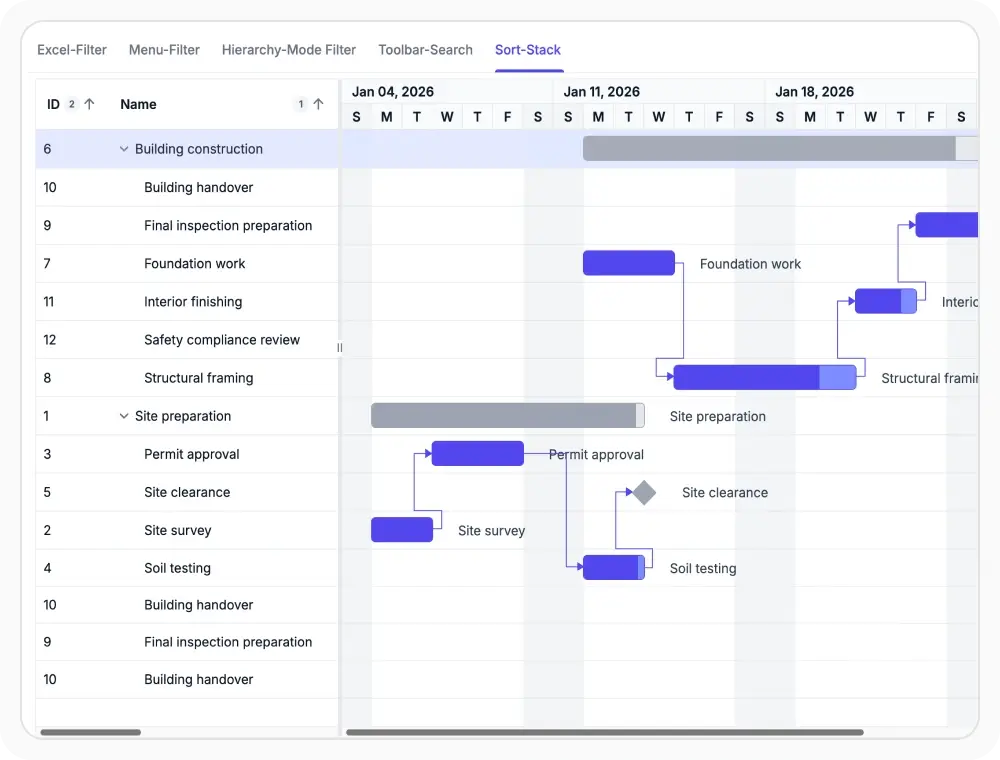
Sort tasks by column values
Sorting arranges tasks in ascending or descending order based on column values. This helps teams organize project data and surface relevant schedule information. Use it when task order must reflect dates, duration, progress, priority, or other task fields.
See Why Developers Love Syncfusion
Our Customers Love Us
Having an excellent set of tools and a great support team, Syncfusion reduces customers’ development time. Here are some of their experiences.





Frequently Asked Questions
What is the difference between Excel and menu filtering in React Gantt Chart?
Excel filtering presents a list of available values for quick selection, while menu filtering supports condition-based filtering such as text matching, date ranges, and numeric comparisons. Both options help users refine schedule data using different filtering approaches.
Can React Gantt Chart search across multiple task details?
Yes. Toolbar search checks React Gantt Chart task data across searchable columns and returns matching records without requiring separate column filters.
How does React Gantt Chart keep hierarchy visible while filtering?
Hierarchy-aware filtering controls whether parent tasks, child tasks, or related task levels remain visible after filtering. This helps preserve project context and prevents tasks from appearing without their associated hierarchy.
Does React Gantt Chart support multi-column sorting?
Yes. React Gantt Chart supports sorting by multiple columns, allowing tasks to be organized using more than one sort condition. This helps teams structure project data based on scheduling and reporting requirements.
Resources
Learn more about React Gantt Chart
Explore demos, KB articles, and documentation to get the most out of React Gantt Chart.
Explore guides, APIs, and quick-start tips
See live use cases in action
Ask, share, and connect with peers
Find solutions and best practices fast
Get expert help when needed
Feature requests and bug reports
Track issues and suggest improvements
Awards
Greatness—it’s one thing to say you have it, but it means more when others recognize it. Syncfusion® is proud to hold the following industry awards.