Try Our Live Demo
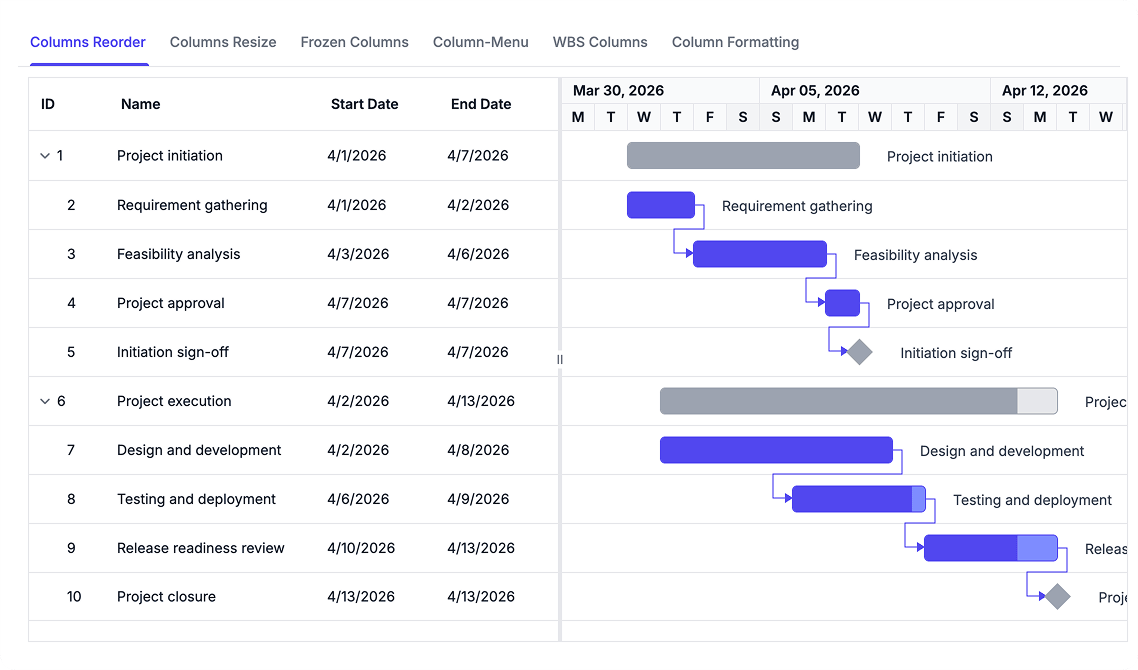
Organize Task Data in the TreeGrid
Configure customizable columns, formatting options, and layouts for different planning and review scenarios. Move, resize, hide, or freeze columns, and use WBS numbering to represent task hierarchy within the project schedule.
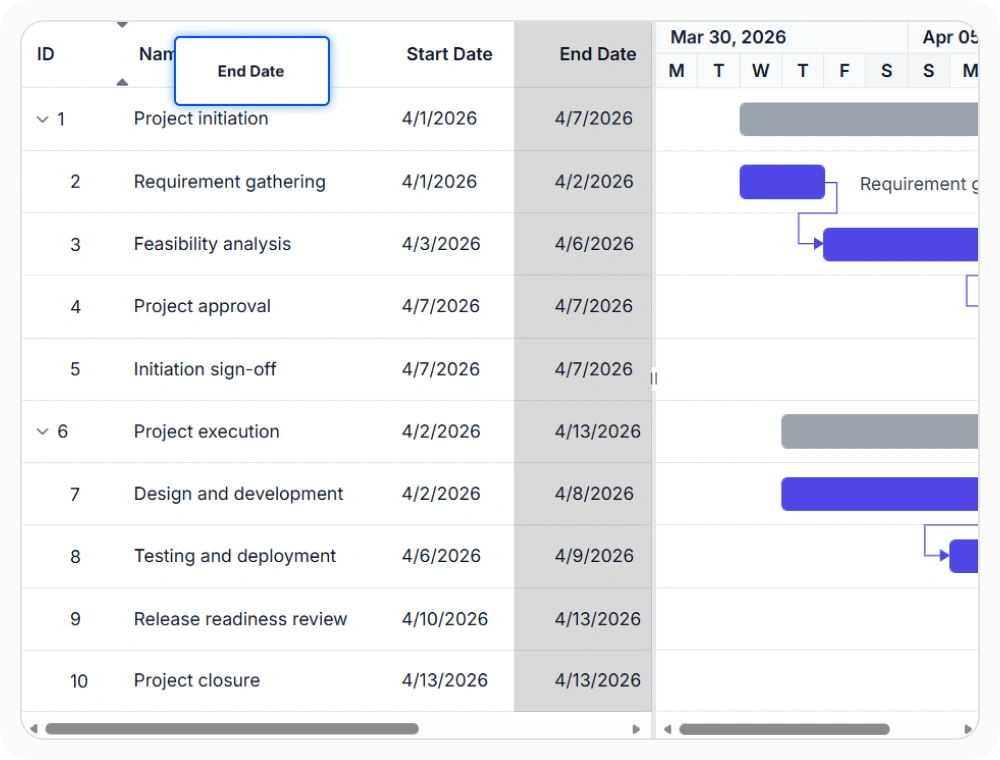
Reorder columns by priority
Column reordering changes the sequence of columns within the project grid to align information with specific review and reporting needs. Use this option when different users or project activities require task fields to be displayed in a preferred order.
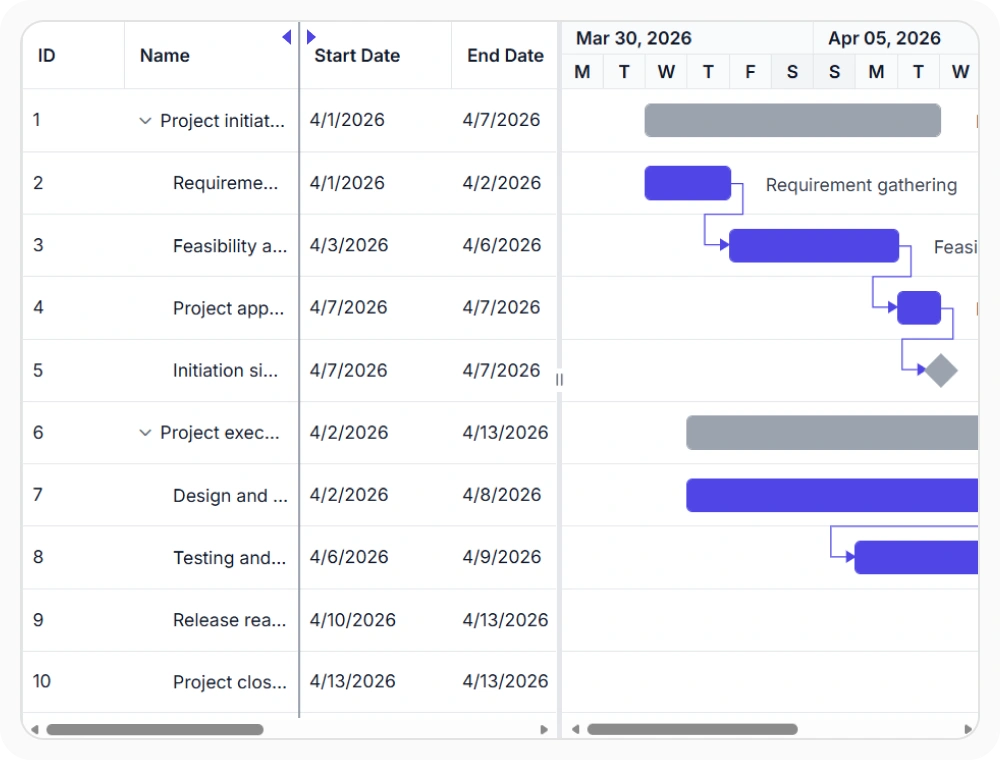
Resize columns
Column resizing adjusts the width of individual columns to accommodate varying amounts of project information and display requirements. Use this option when task data requires additional space or when layouts need to fit different viewing environments.
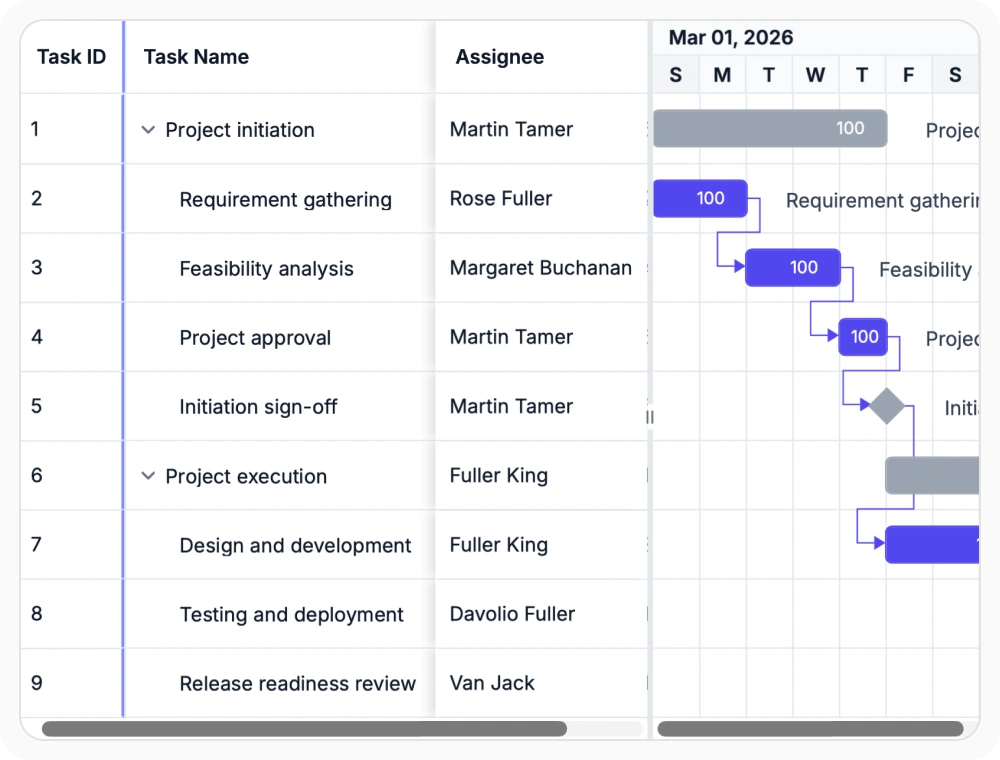
Keep context with frozen columns
Frozen columns keep selected columns visible while other columns scroll horizontally, maintaining access to key project information across wide schedules. Use this option when task identification or critical reference fields need to remain visible during project reviews.
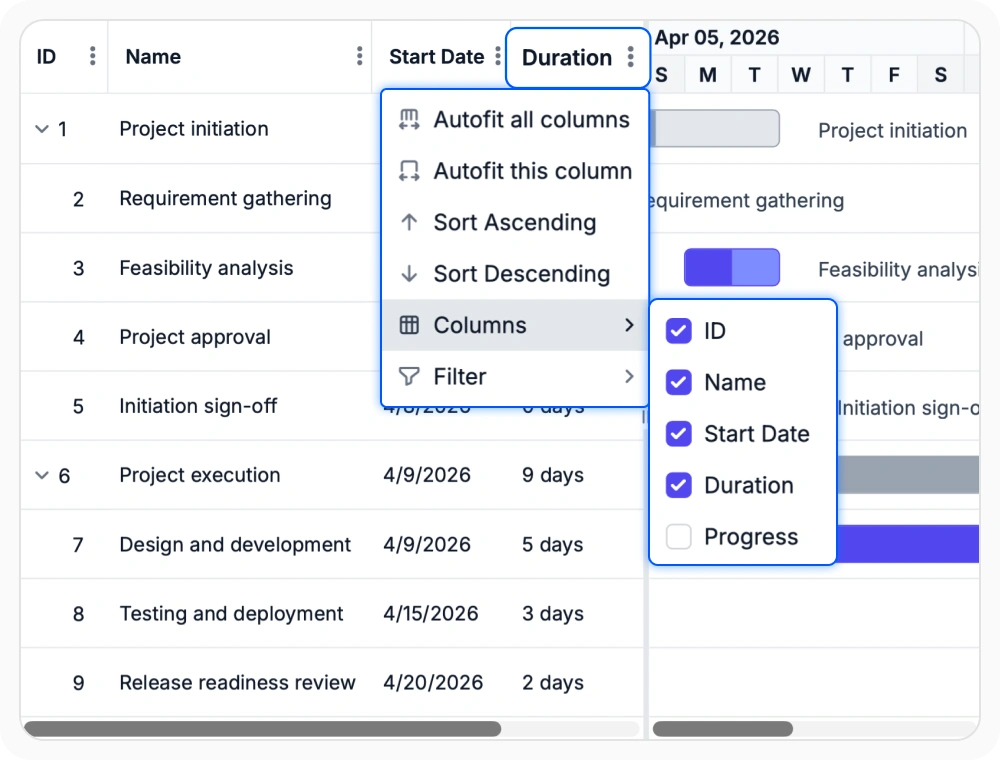
Manage columns with column menu
The column menu centralizes common column management actions within each column header, making it easier to control how project information is displayed. Use this option when teams need to frequently adjust columns during project reviews and analysis.
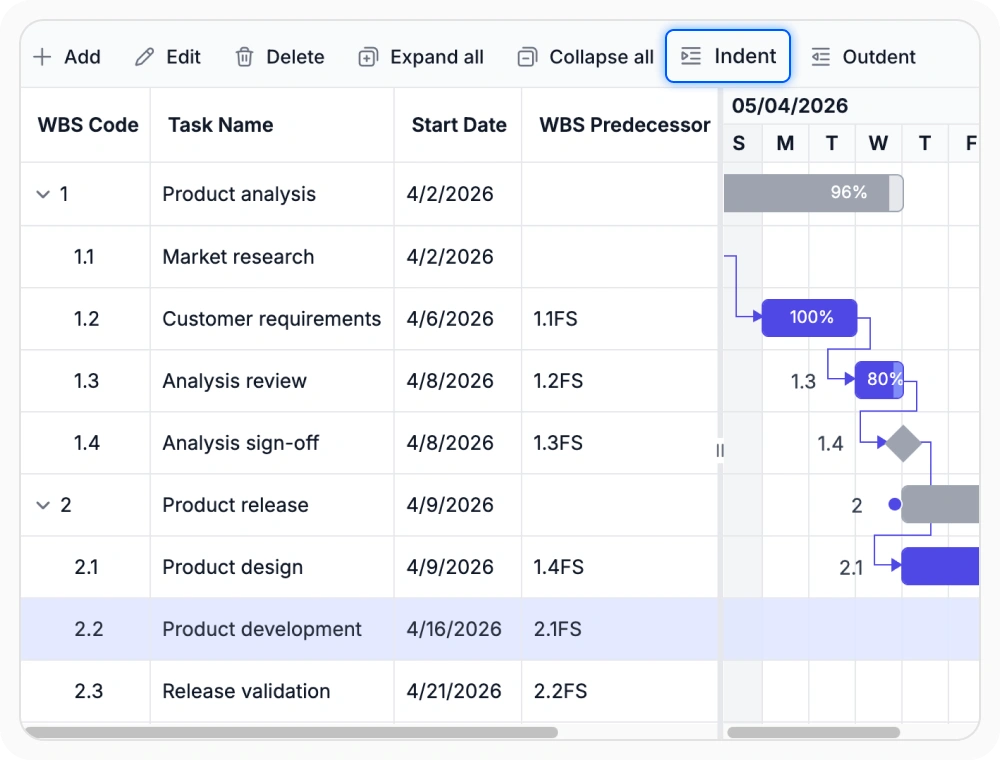
Structure projects with WBS numbering
WBS numbering organizes tasks using hierarchical codes that reflect parent-child relationships within a project schedule. Use this option when managing projects that require a formal work breakdown structure and defined task hierarchy.
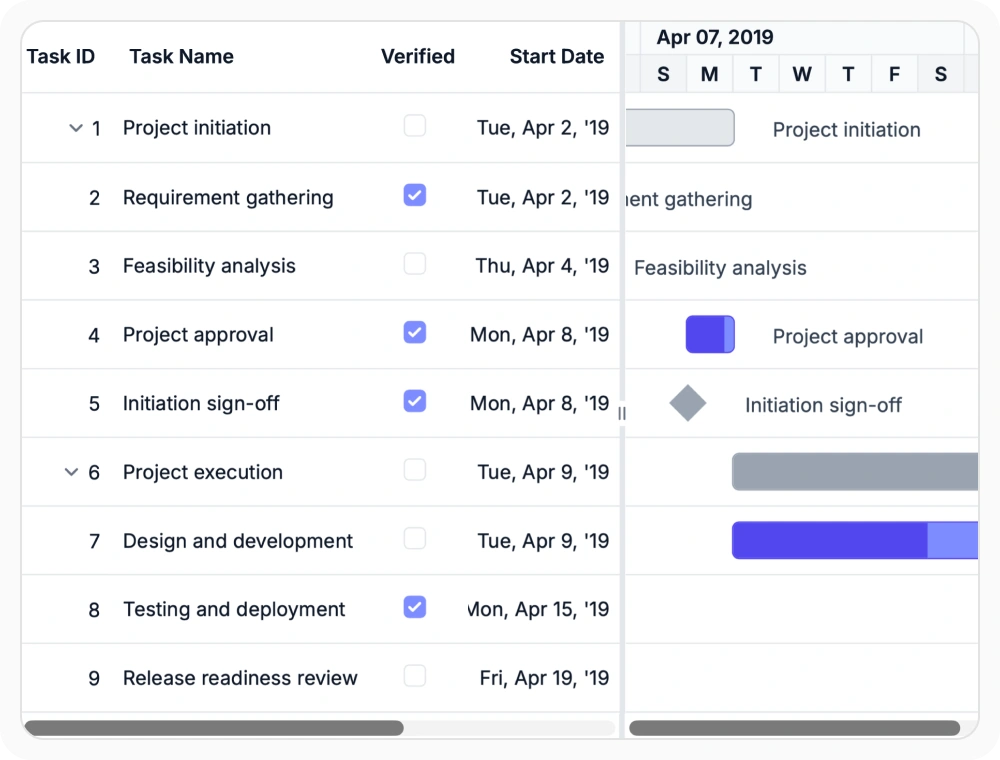
Format column values
Column formatting controls how project data is presented within columns, including values such as dates, numbers, percentages, and currencies. Use this option when project information requires specific display formats to support reporting, analysis, or regional standards.
See Why Developers Love Syncfusion
Our Customers Love Us
Having an excellent set of tools and a great support team, Syncfusion reduces customers’ development time. Here are some of their experiences.





Frequently Asked Questions
How does React Gantt Chart handle column formatting?
React Gantt Chart formats dates, numbers, percentages, and related values within task cells. This supports consistent presentation across mixed data types.
Can columns be shown or hidden in React Gantt Chart?
Yes. Column visibility can be adjusted to focus on the most relevant task details for a specific review or planning activity. This helps simplify project views without removing underlying task information.
Why is a WBS column useful in React Gantt Chart project schedules?
The WBS column identifies tasks through structured hierarchical numbering. It supports task references and review across complex project schedules.
What can the column menu do in React Gantt Chart?
The column menu provides quick access to common header actions such as sorting, filtering, and showing or hiding columns. This helps teams adjust the tree grid without disrupting review flow.
How do frozen columns help in React Gantt Chart?
Frozen columns keep important task details visible while other columns scroll horizontally. This is useful when wide project views make it harder to maintain context.
Can columns be resized or reordered in React Gantt Chart?
Yes. Column widths can be adjusted for available space, and fields can be reordered to match the needs of a specific project review layout.
Resources
Learn more about React Gantt Chart
Explore demos, KB articles, and documentation to get the most out of React Gantt Chart.
Explore guides, APIs, and quick-start tips
See live use cases in action
Ask, share, and connect with peers
Find solutions and best practices fast
Get expert help when needed
Feature requests and bug reports
Track issues and suggest improvements
Awards
Greatness—it’s one thing to say you have it, but it means more when others recognize it. Syncfusion® is proud to hold the following industry awards.