Skip to content
Blogs
Search blogs
Select Categories
WPF
11 min read
Jan 19, 2026
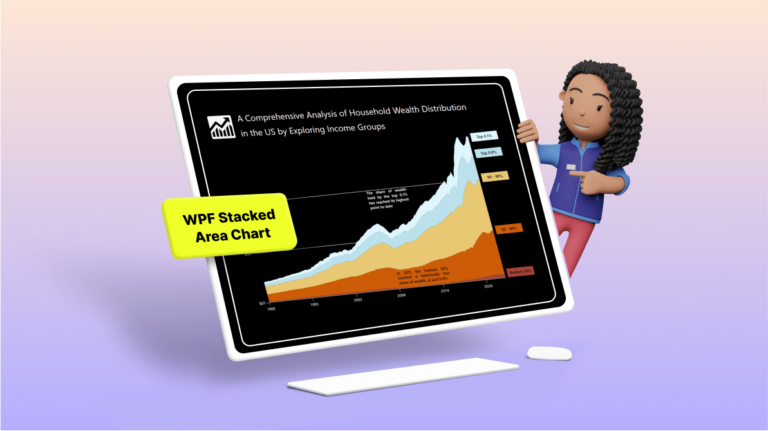
Chart of the Week: Creating a WPF Stacked Area Chart to Visualize Wealth Distribution in the U.S.
Arul Jenith Berkmans
8 min read
Jan 19, 2026
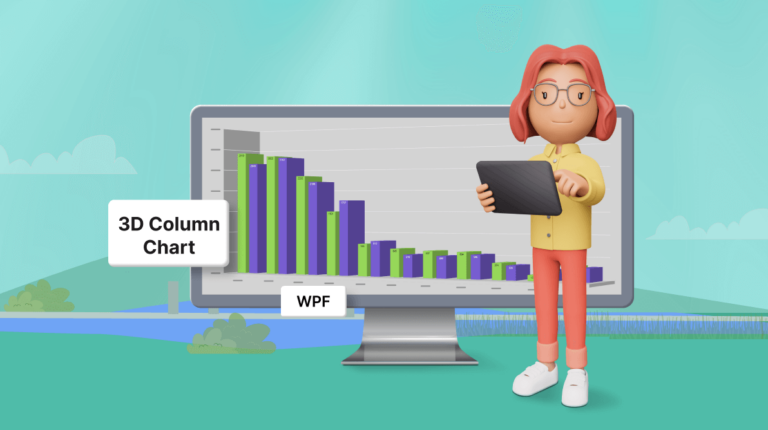
Chart of the Week: Creating a WPF 3D Column Chart to Visualize the Panama Canal’s Shipment Transit Data
Surya Karan Raja
12 min read
Jan 19, 2026
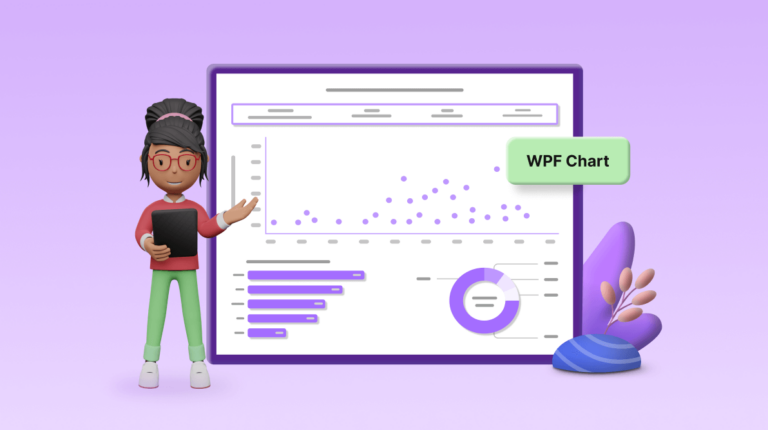
Chart of the Week: Creating a WPF Chart Dashboard to Visualize the 2023 World Billionaires List
Sowndharya Selladurai
5 min read
Jan 19, 2026
Harmonizing Powerhouses: Syncfusion WPF Controls Are Now Compatible with Avalonia XPF
Gayathri Ramalingam
8 min read
Apr 22, 2025
Chart of the Week: Creating a WPF Bar Chart to Visualize the Homelands of America's International Students
Saiyath Ali Fathima M
6 min read
Jan 19, 2026
Chart of the Week: Creating a WPF Stacked Bar Chart to Visualize the Social Media Use of US Teens in 2023
Karthikeyan V
4 min read
Jan 9, 2026
What’s New in 2023 Volume 4: WinUI and WPF
Rajeshwari P
6 min read
Jan 19, 2026
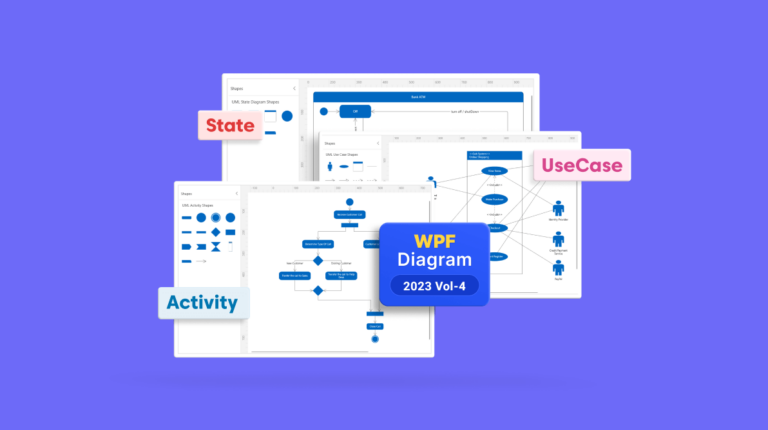
What’s New in WPF Diagram: 2023 Volume 4
Prakash Perumal
6 min read
Jan 19, 2026
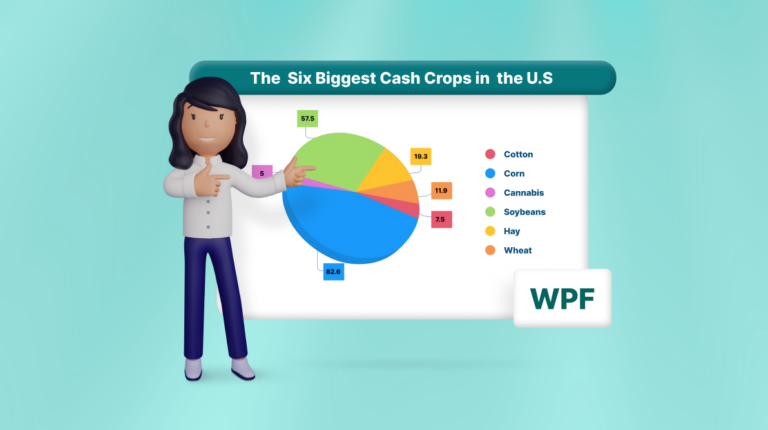
Chart of the Week: Creating a WPF 3D Pie Chart to Display the Biggest Cash Crops in the U.S
Saiyath Ali Fathima M
1
…
3
4
5
6
7
8
9
…
20
1
…
5
6
7
…
20
 Arul Jenith Berkmans
 Surya Karan Raja
 Sowndharya Selladurai

 Gayathri Ramalingam
 Saiyath Ali Fathima M
 Karthikeyan V

 Rajeshwari P
 Prakash Perumal