Skip to content
Blogs
Search blogs
Select Categories
Data Visualization
11 min read
Nov 6, 2025
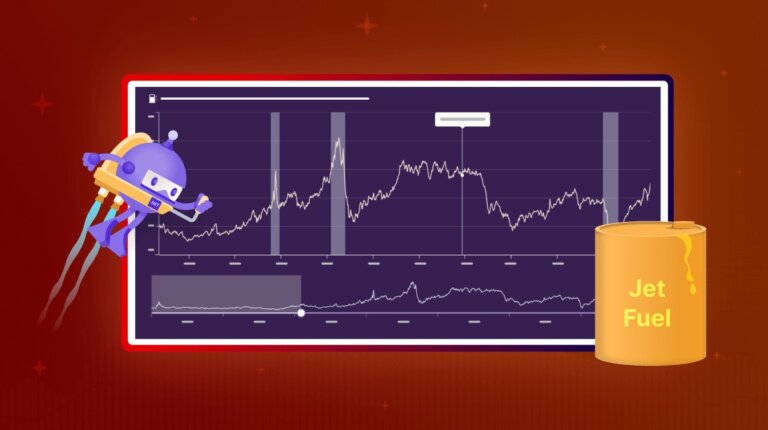
Visualize U.S. Gulf Coast Kerosene-Type Jet Fuel Prices with .NET MAUI Fast Line Chart
Arul Jenith Berkmans
10 min read
Feb 10, 2026
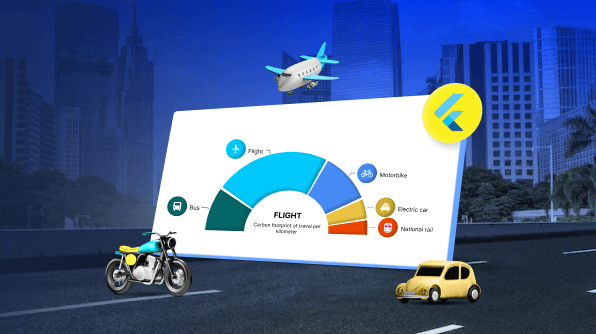
Create a Flutter Semi-Doughnut Chart to Visualize Transport Emissions per Kilometer Traveled
Aswini Suresh Reddy
10 min read
Jan 14, 2026
Easily Create a Bullet Graph with Flutter Charts
Natrayan Ramalingam
9 min read
Feb 10, 2026
Easily Draw Custom Shapes in Flutter Cartesian Charts
Hariharasudhan Kanagaraj
9 min read
Jan 19, 2026
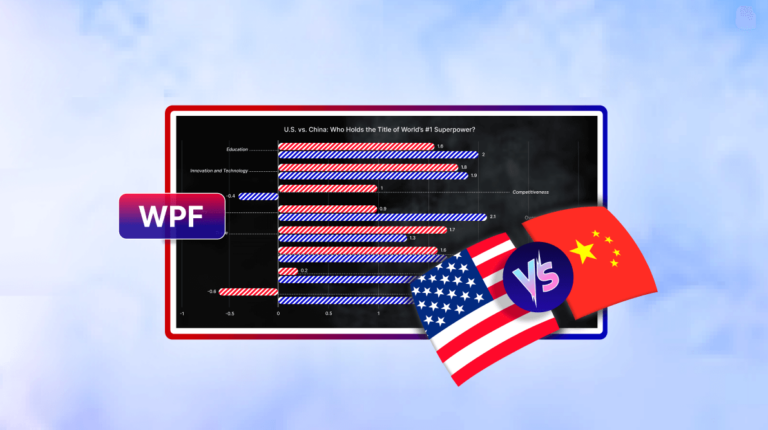
Create a WPF Multi-Bar Chart to Visualize U.S. vs. China Superpower Status
Saiyath Ali Fathima M
9 min read
Jan 9, 2026
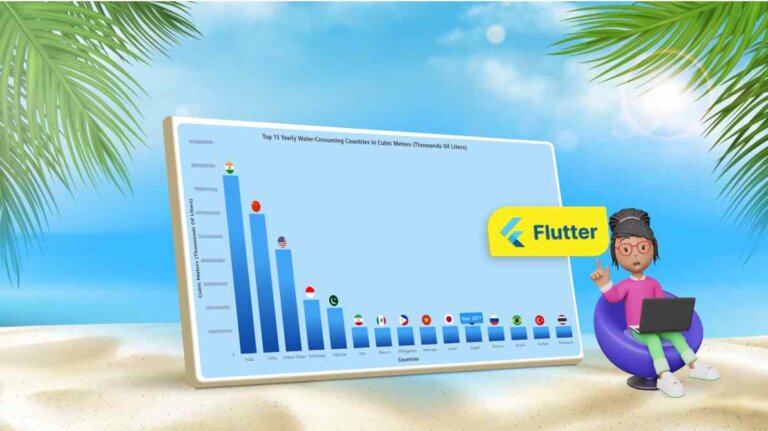
Create a Flutter Column Chart to View the Top 15 Water-Consuming Countries in the World
Preethika Selvam
11 min read
Jan 19, 2026
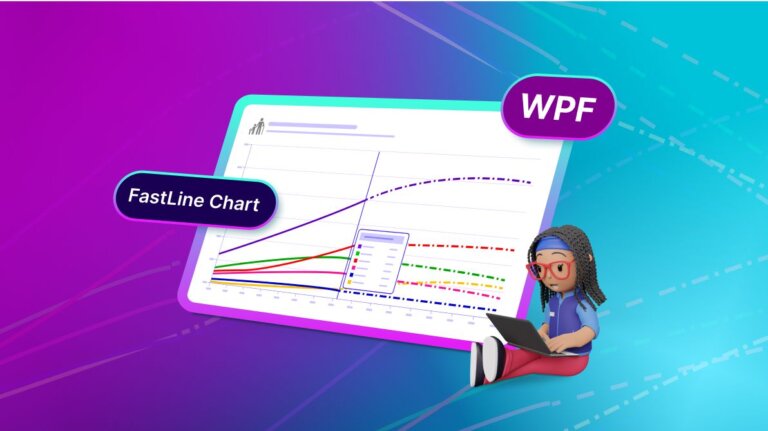
Create a WPF FastLine Chart to Analyze Global Population Trends by Age Group
Vimala Thirumalai Kumar
9 min read
Mar 20, 2025
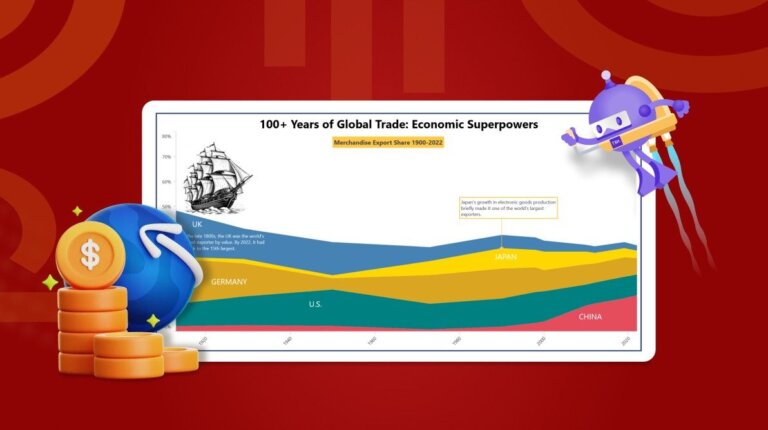
View 100+ Years of Economic Superpowers' Exports with .NET MAUI Stacked Area Chart
Nitheeshkumar Thangaraj
6 min read
Jan 16, 2026
Effortlessly Visualize and Manage Data with Blazor TreeView
Keerthana Rajendran
1
…
10
11
12
13
14
15
16
…
22
1
…
12
13
14
…
22
 Arul Jenith Berkmans
 Aswini Suresh Reddy

 Natrayan Ramalingam

 Hariharasudhan Kanagaraj
 Saiyath Ali Fathima M
 Preethika Selvam
 Vimala Thirumalai Kumar
 Nitheeshkumar Thangaraj

 Keerthana Rajendran