Skip to content
Blogs
Search blogs
Select Categories
Data Visualization
9 min read
Jan 15, 2026
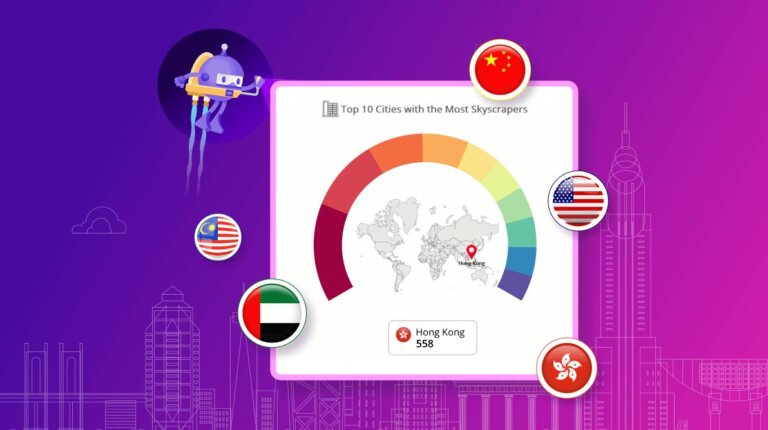
Visualizing Skyscraper Data with .NET MAUI Doughnut Chart and Maps
Saiyath Ali Fathima M
5 min read
Nov 6, 2025
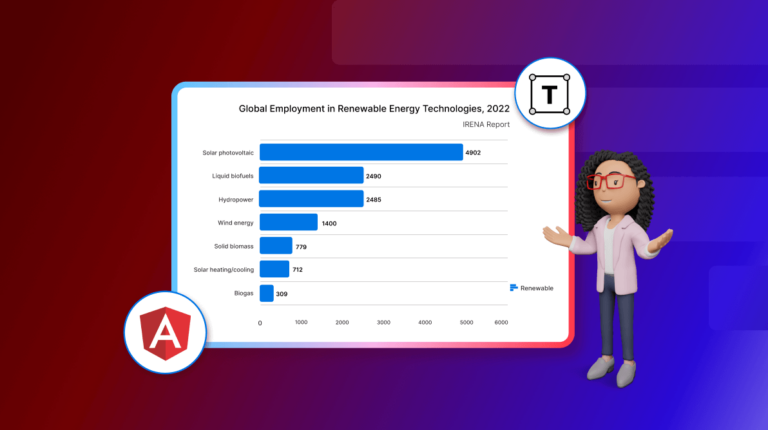
Mastering Font Usage in Angular Charts
Gowrimathi S
12 min read
Nov 6, 2025
Building a Neumorphic UI with .NET MAUI Column Chart to Showcase Gen Z’s Favourite Social Media Platforms
Dhanaraj Rajendran
13 min read
Nov 6, 2025
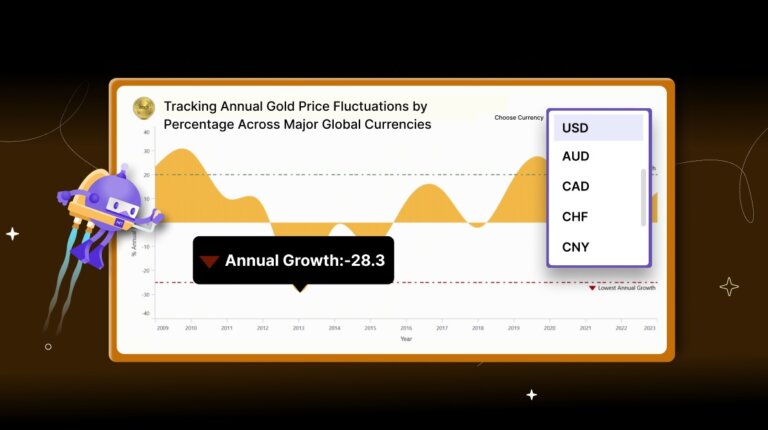
Create a .NET MAUI Spline Area Chart to Track Annual Gold Price Fluctuations Across Major Global Currencies
Sowndharya Selladurai
18 min read
Jun 26, 2026
Easily Create Interactive UML Class Diagrams in Angular
Sarathkumar V
12 min read
Mar 20, 2025
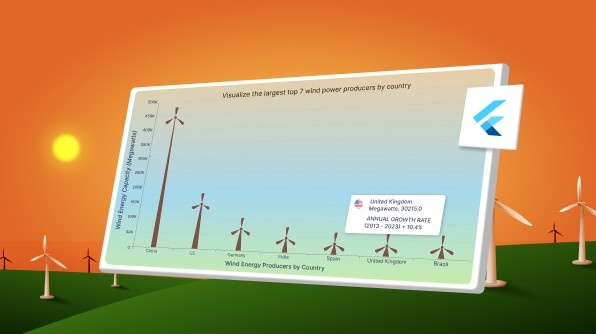
Create a Flutter Column Chart to Visualize the World's Largest Wind Power Producers
Natrayan Ramalingam
19 min read
Apr 22, 2025
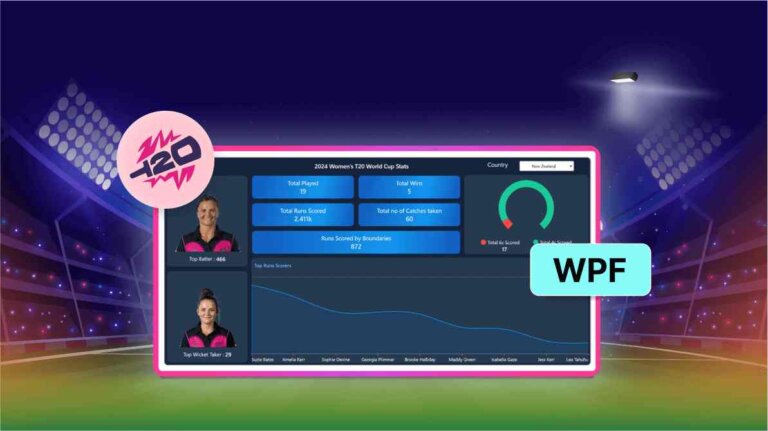
Creating a Dynamic WPF Chart Dashboard to Showcase 2024 Women's T20 World Cup Statistics
Saiyath Ali Fathima M
3 min read
Nov 6, 2025
Enhance Data Visualization with Markers in Angular Charts
Gowrimathi S
4 min read
Jan 9, 2026
Celebrating 75 Blogs of Chart Excellence: A Journey with Syncfusion Charts
Saravanan Madheswaran
1
…
9
10
11
12
13
14
15
…
22
1
…
11
12
13
…
22
 Saiyath Ali Fathima M
 Gowrimathi S

 Dhanaraj Rajendran
 Sowndharya Selladurai

 Sarathkumar V
 Natrayan Ramalingam

 Saravanan Madheswaran