Skip to content
Blogs
Search blogs
Select Categories
Charts
7 min read
Jan 12, 2026
Chart of the Week: Creating a .NET MAUI Histogram Chart to Display the Distribution of Atomic Weights in the Periodic Table
Surya Karan Raja
10 min read
Jan 19, 2026
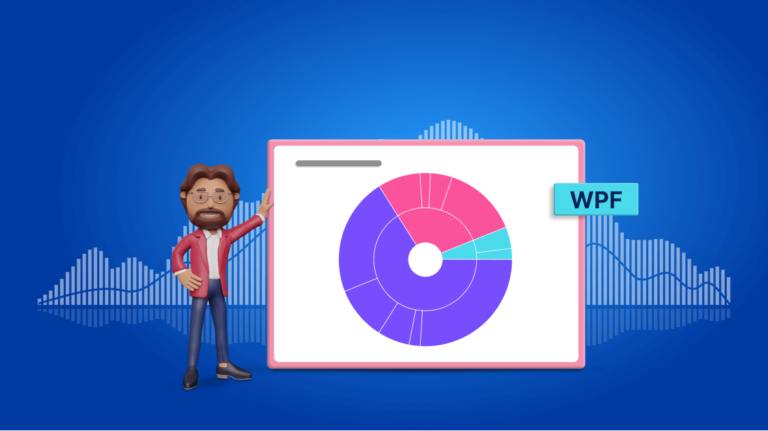
Chart of the Week: Creating a WPF Sunburst Chart to Visualize the Syncfusion Chart of the Week Blog Series
Saiyath Ali Fathima M
5 min read
Jan 15, 2026
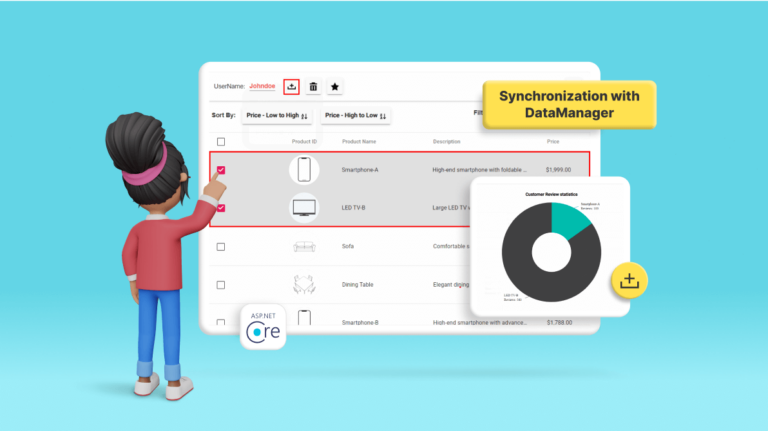
Effortlessly Synchronize JavaScript Controls Using DataManager
Maithiliy K
13 min read
Jan 15, 2026
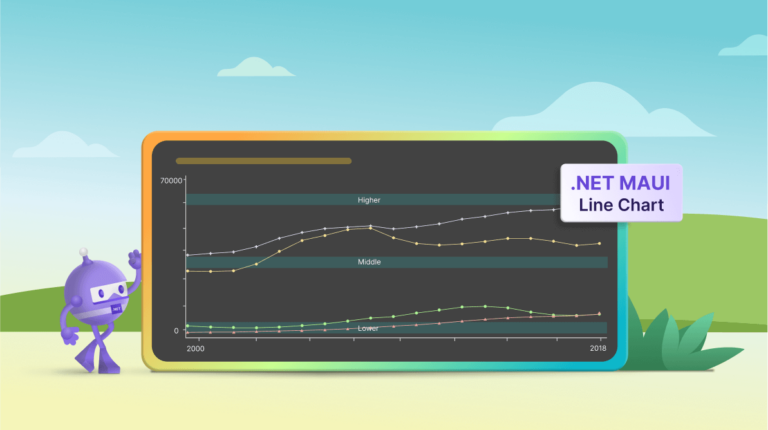
Chart of the Week: Creating a .NET MAUI Line Chart with Plot Bands to Explore Global GNI Per Capita with Income Thresholds
Sowndharya Selladurai
8 min read
Jan 9, 2026
Reached 50! A Milestone for the Chart of the Week Blog Series
Vimala Thirumalai Kumar
8 min read
Jan 15, 2026
Chart of the Week: Creating a .NET MAUI Line Chart to Analyze Wage Trends in the Texas Oil Gas Extraction Industry
Nanthini Mahalingam
1 min read
Jan 30, 2026
Visualize Customer Survey Reports Using React 3D Circular Charts [Webinar Show Notes]
Carter Harris
7 min read
Jan 19, 2026
Chart of the Week: Creating a WPF 100% Stacked Area Chart to Visualize the World Vehicle Production in Major Countries
Karthikeyan V
9 min read
Feb 10, 2026
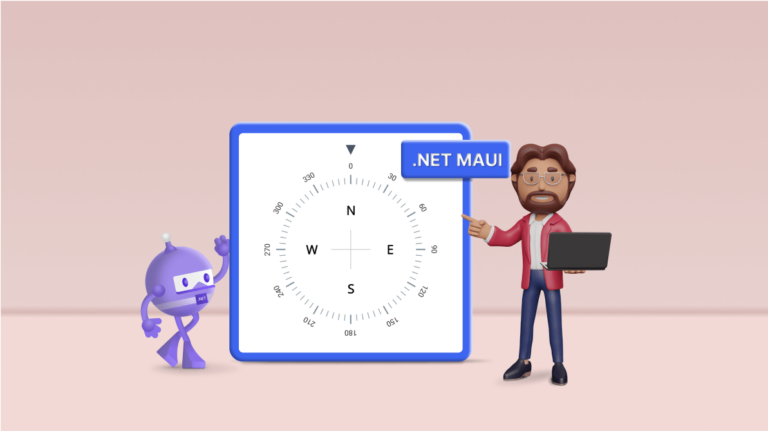
Easily Create a Directional Compass Using .NET MAUI Radial Gauge
Jeyasri Murugan
1
…
5
6
7
8
9
10
11
…
18
1
…
7
8
9
…
18

 Surya Karan Raja
 Saiyath Ali Fathima M
 Maithiliy K
 Sowndharya Selladurai
 Vimala Thirumalai Kumar
 Nanthini Mahalingam

 Carter Harris

 Karthikeyan V
 Jeyasri Murugan