

TL;DR: React chart libraries in 2026 reflect shifts in performance constraints, mobile expectations, customization depth, and data scale. This article examines how modern libraries approach rendering, interactivity, chart variety, and developer ergonomics, then compares five widely used chart options shaping today’s React dashboards.
Overview: React Chart Libraries in 2026
React charting has quietly changed over the last few years, not through radical API redesigns, but through how libraries respond to real production pressure. Large datasets, touch‑first user behavior, accessibility requirements, and long‑running dashboards now shape library design more than visual polish alone.
A few patterns show up across most modern React chart libraries:
- Enhanced performance: Libraries increasingly move away from pure SVG when datasets grow. Canvas rendering and viewport-based virtualization have become baseline expectations, not optimizations you “turn on later.” These techniques matter most when charts stop being static visuals and start acting like live components inside complex dashboards.
- Mobile-compatible design: Responsive resizing is no longer enough. Touch gestures, hit‑testing accuracy, tooltip behavior, and interaction density are now part of chart design, not afterthoughts. Libraries that assume mouse-only interactions tend to feel dated on modern devices.
- Advanced customization: The difference between “configurable” and “usable in production” often comes down to how much control developers have over theming, typography, spacing, and interaction states. Libraries have expanded customization not just for aesthetics, but to fit strict design systems and white‑label requirements.
- Expanded chart types: Basic line and bar charts remain common, but modern apps increasingly require statistical, financial, comparative, and domain-specific visualizations. Chart libraries now aim to reduce the need for custom D3 work by offering broader built-in coverage.

Five React Chart Libraries developers commonly evaluate
Selecting a chart library in 2026 often has less to do with “which looks best” and more to do with how well it survives real data, real users, and long-term maintenance. Below are five libraries that frequently show up in React architecture discussions.
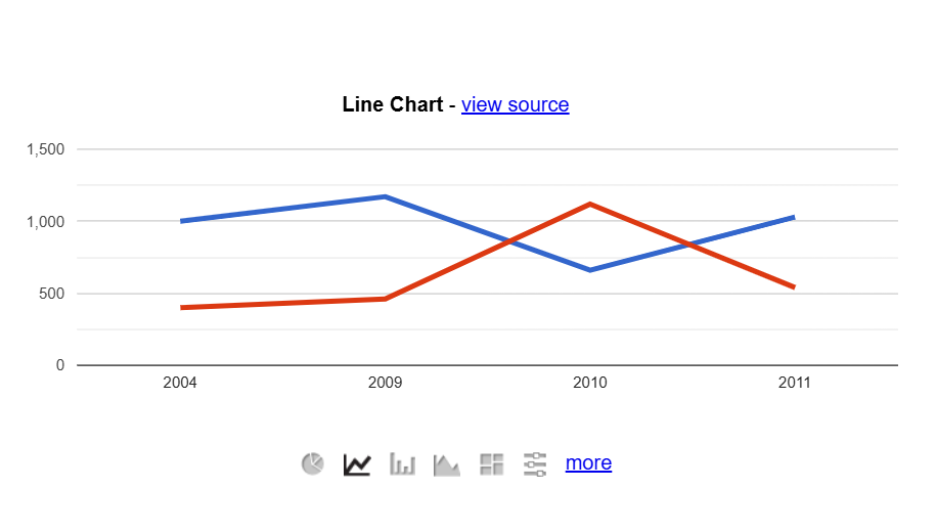
1. React Google Charts
React Google Charts is a lightweight and fully typed React wrapper for Google Charts, offering a simple API for integration.
To add React Google Charts to your application, install the package using the following command:
npm install react-google-charts
The key benefits include:
- Ease of integration: Simplifies adding charts to React apps.
- Variety of charts: Supports line charts, bar charts, radar charts, and doughnut charts.
- Customization: Offers a range of options for creating highly tailored visualizations.
2. Recharts
Built on React and D3, Recharts is a redefined charting library with a modular approach. It focuses on declarative components and ease of integration with React.
To add Recharts to your application, install the package using the following command:
npm install recharts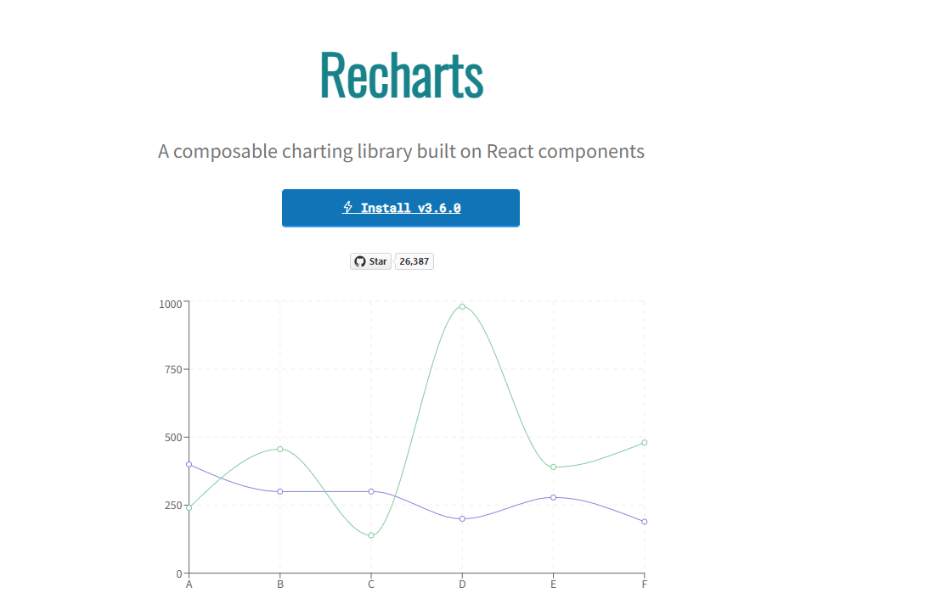
Why choose Recharts?
- Flexibility: Offers bar, line, area, and pie charts.
- Customizability: A modular design and versatile components allow for deep customization.
- Lightweight: Depends only on specific D3 submodules.
- Native SVG support: Charts are rendered with native SVG elements.
3. Syncfusion® React Charts
Syncfusion React Charts provides a comprehensive charting solution as part of its larger UI component ecosystem. Its chart library supports a wide variety of chart types and focuses on consistency, performance, and integration within enterprise applications.
- Offers a broad set of chart types with built-in interactivity and responsiveness
- Integrates well with React and other frameworks
- API-rich configuration similar in depth to Highcharts
- Best suited for teams already using Syncfusion UI components
To add Syncfusion React Charts to your application, install the package using the following command:
npm install @syncfusion/ej2-react-charts --save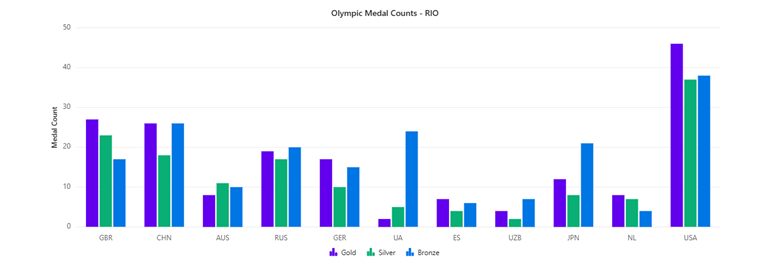
Why choose Syncfusion React Charts?
- Wide Chart support: 55+ built-in chart types for diverse use cases.
- High performance: Handles large and real-time datasets efficiently.
- Interactive features: Zooming, panning, tooltips, and drill-down support.
- Customizable design: Control colors, fonts, and layouts; light & dark themes.
- Responsive & mobile‑ready: Touch-enabled and adapts to any screen size
- Export options: Save charts as PNG, JPG, PDF, or SVG.
- Smooth animations: Built-in transitions with no extra configuration.
- Developer friendly: Seamless React integration with rich APIs.
4. react-chartjs-2
A React wrapper for the popular Chart.js library, react-chartjs-2, focuses on simplicity and versatility. It works well for common chart types and quick implementations.
To add react-chartjs-2 to your application, install the package using the following command:
npm install react-chartjs-2 chart.js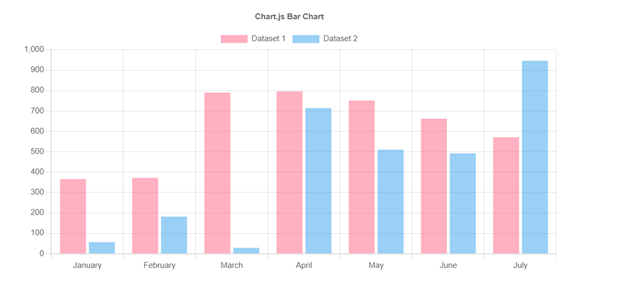
The following are the key features:
- Diverse chart types: Bar, radial, pie, and more.
- Reusable components: Leverages React’s component-based architecture.
- Customization: Allows users to create custom chart designs.
- Interactivity: Supports animations and dynamic data updates.
5. Highcharts
Highcharts is a feature-rich JavaScript charting library known for its polished output and advanced chart types. It supports a wide range of visualizations and includes built-in features such as exporting, accessibility, and responsiveness.
To add Highcharts to your application, install the package using the following command:
npm install highcharts highcharts-react-official
Here’s what the Highcharts offers:
- Export options: Exports data in various formats like CSV, Excel, and HTML.
- Ease of use: Offers well-organized documentation and examples for developers.
- Responsive, interactive, and accessible charts: Highcharts is a pure JavaScript charting library based on SVG that makes it easy to create responsive, interactive, and accessible charts.
- Compatibility: Works with React 16.4+ seamlessly.
Summary comparison
A comparative summary of the overall findings is presented below.
| Library | Learning curve | Customization | React integration | Typical use case |
| Highcharts | Low–Medium | High | Official Wrapper | Feature-rich business charts |
| Chart.js | Low | Low–Medium | Community Support | Simple charts and dashboards |
| Syncfusion | Medium | High | First-class React support | Enterprise applications | D3.js | High | Very High | Manual Integration | Custom data visualizations |
| Recharts | Low–Medium | Medium | React-native | React dashboards |
From responsive chart layouts to rich customization, interactive features, annotations, legends, tooltips, and export options, Syncfusion React Charts helps you build polished data visualization experiences faster.
View Live DemoFrequently Asked Questions
What separates modern chart libraries from earlier generations?
Performance strategies (canvas and virtualization), mobile-first interaction models, deeper customization, broader chart coverage, and built-in accessibility expectations.
What matters most for large datasets or live updates?
Rendering strategy, interaction cost, and how much logic the library handles internally versus pushing onto the application layer.
What factors usually drive final selection?
Data volume, interaction complexity, design system requirements, accessibility constraints, export needs, and long-term maintenance considerations.
Conclusion: Choosing the right React chart library
Each of these five popular React chart libraries has its strengths and weaknesses. Choosing the best library depends on your project’s specific requirements:
- You need charts as part of a larger UI component suite
- Your application requires multiple chart types with consistent APIs
- The project prioritizes long-term maintenance and uniform component behavior
To unlock the full potential of your data through visualization, carefully consider your project’s needs and choose the library that best aligns with them.
Try these out! Explore the Syncfusion Charts component for all of these frameworks:
Curious about the standout capabilities of Syncfusion React Charts? Explore the comprehensive documentation to understand the full set of data visualization features.


 No spam, just valuable updates.