
 Meena Alagiah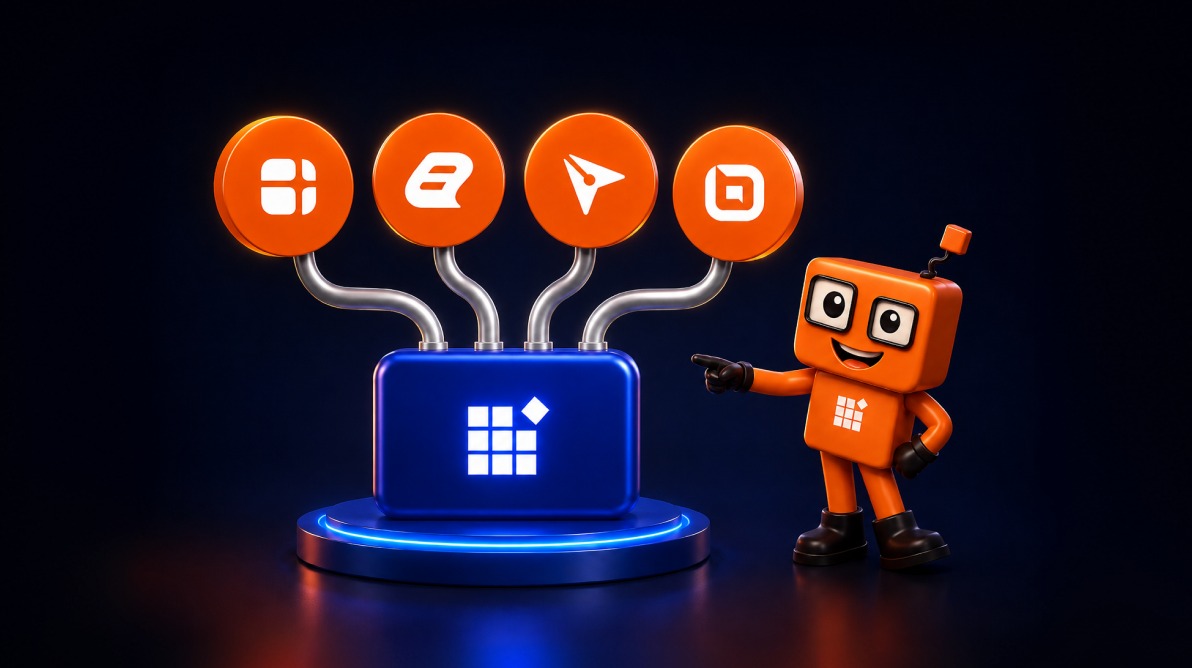
TL;DR: What happens when a developer-tools company becomes a customer of its own technology? At Syncfusion, the same reusable UI and document technologies we offer developers are also used across BoldSign, BoldDesk, Bold BI, and Bold Reports. Each product solves a different problem, but together they show the same principle: reuse common engineering building blocks, invest in domain-specific innovation, and learn from using those tools in real SaaS products.
When developers evaluate a UI component library or document-processing platform, they usually ask familiar questions.
Does it support the frameworks we use? Is it fast? Can we customize it? Are the APIs intuitive? Is the documentation good? What about accessibility, support, and licensing? Will it scale with the application?
There is another question worth asking:
Does the company building the technology trust it enough to use it in its own products?
At Syncfusion®, we do.
Technologies from Syncfusion’s own developer ecosystem, including UI components, data visualization controls, document-processing libraries, viewers, editors, and related SDKs, are used as building blocks across BoldSign, BoldDesk, Bold BI, and Bold Reports.
Those four SaaS products solve very different problems:
- BoldSign supports eSignature and document processing.
- BoldDesk provides customer-support and help-desk experiences.
- Bold BI delivers analytics and dashboards.
- Bold Reports supports report design, processing, viewing, and delivery.
That difference is what makes their use of shared technologies interesting.
A PDF-processing library inside an eSignature platform solves a very different problem from a DataGrid inside a support workspace. A TreeView inside an analytics designer serves a different purpose from the same type of navigation control inside a reporting application.
The reusable technology is only one layer.
Each product combines those building blocks with its own business logic, APIs, services, security, data models, processes, infrastructure, and product experience.
A component is a building block, not the product. Its value is in solving recurring engineering problems so product teams can focus more of their effort on the functionality that differentiates their application.
Let’s look at how that works across four very different Syncfusion products.
One technology ecosystem, four SaaS experiences
At a high level, the relationship looks like this:
| Product | Primary experience | Shared technology area |
| BoldSign | eSignature and document processes | PDF and document processing |
| BoldDesk | Customer support | UI components and interaction controls |
| Bold BI | Analytics and dashboards | UI, data-management, and visualization components |
| Bold Reports | Reporting | UI, visualization, reporting, and document technologies |
The important part is not how many components appear in each product. It is how reusable technologies are combined with product-specific engineering to solve real business problems.
BoldSign: From document processing to eSignature management
Electronic signatures revolve around documents.
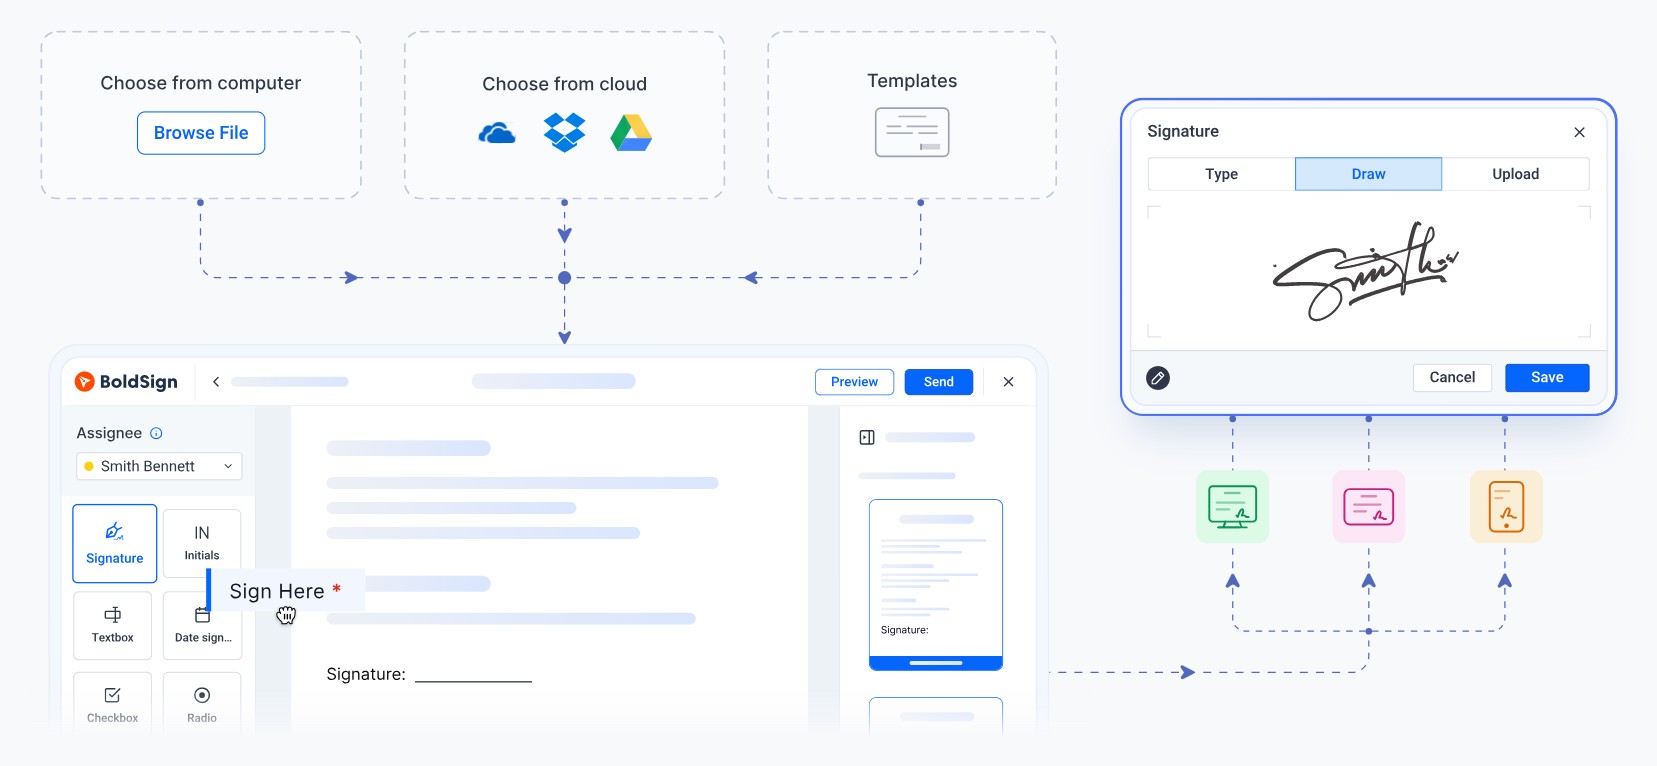
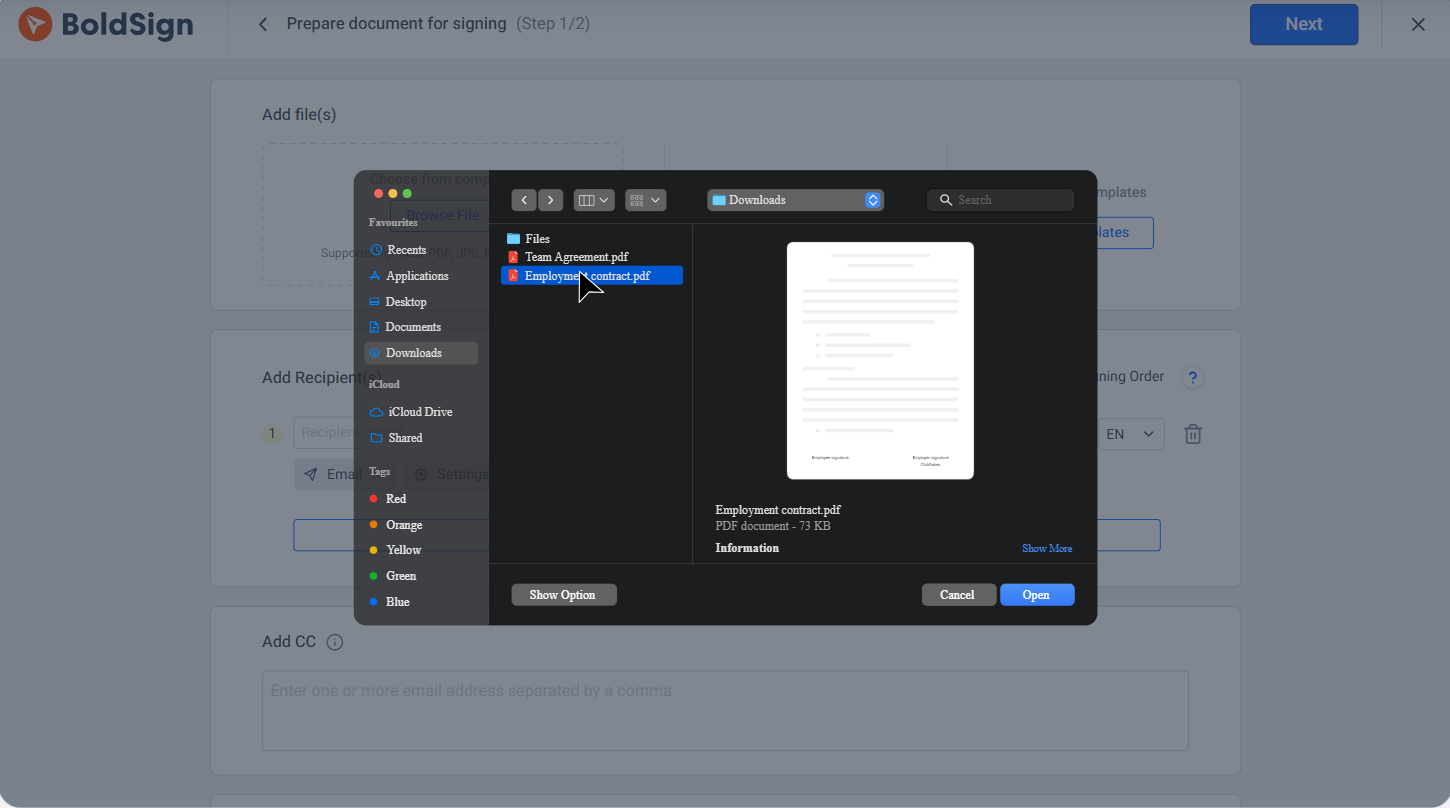
Users upload contracts, agreements, consent forms, offer letters, and other business files. Those documents may need to be prepared for signing, converted into an appropriate format, populated with fields, processed, signed, and ultimately delivered as completed records.
That creates two distinct layers of engineering.
- The first is document mechanics.
- The second is the eSignature processing built around those mechanics.
The reusable document layer
BoldSign uses Syncfusion document-processing technologies for operations that can include:
- Drawing text into documents.
- Extracting text.
- Accessing PDF form fields.
- Flattening interactive form fields.
- Processing supported document formats.
- Converting supported Word, Excel, and PowerPoint documents to PDF.
A simplified document flow can be represented as:
Input document → Conversion → PDF processing → Form-field handling → Signing → Completed document
The underlying document technologies handle the mechanics of working with files. BoldSign then adds the product-specific experience around them.
What BoldSign adds
An eSignature platform needs much more than PDF manipulation.
The product layer handles capabilities such as:
- Signer management
- Signing order
- Authentication
- Templates
- Notifications and reminders
- Status tracking
- Audit history
- APIs and integrations
- Business rules
- Team operations
This separation is useful from an architecture perspective.
The reusable document layer solves document-processing problems. BoldSign concentrates its product engineering on how people prepare, send, sign, track, and manage agreements.
Developer takeaway: Reuse document mechanics where they are not your differentiator. Invest your product engineering in the process that creates value for your users.
BoldDesk: Composing UI components into a support workspace
A customer-support platform presents a completely different challenge.
A support agent may need to work with a ticket queue, customer information, conversations, attachments, status changes, internal collaboration, dashboards, and configuration, all within the same application.
No single UI component creates that experience. Instead, the product is assembled from many smaller interaction patterns.
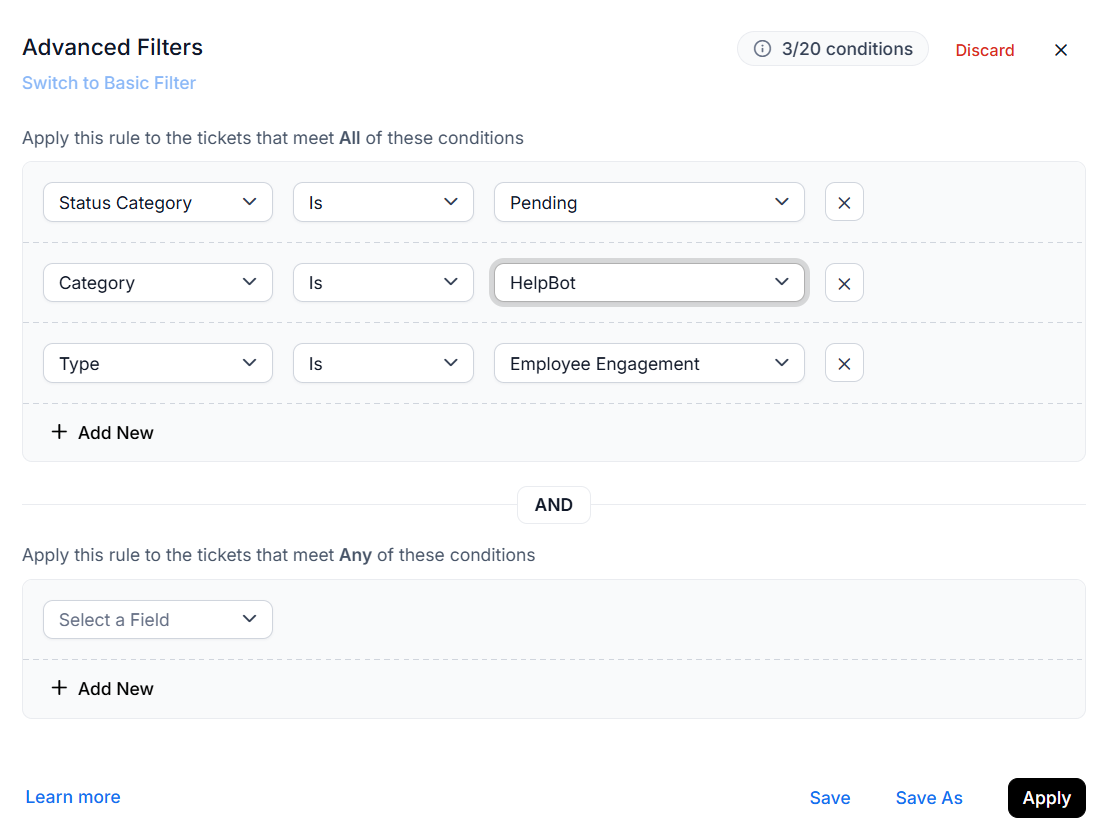
Ticket management
Support teams regularly work with large sets of structured records.
Components such as DataGrid, Query Builder, and editing controls can provide a foundation for viewing, filtering, searching, and updating ticket and customer information.
Conceptually:
DataGrid + Query Builder + editing → Ticket management
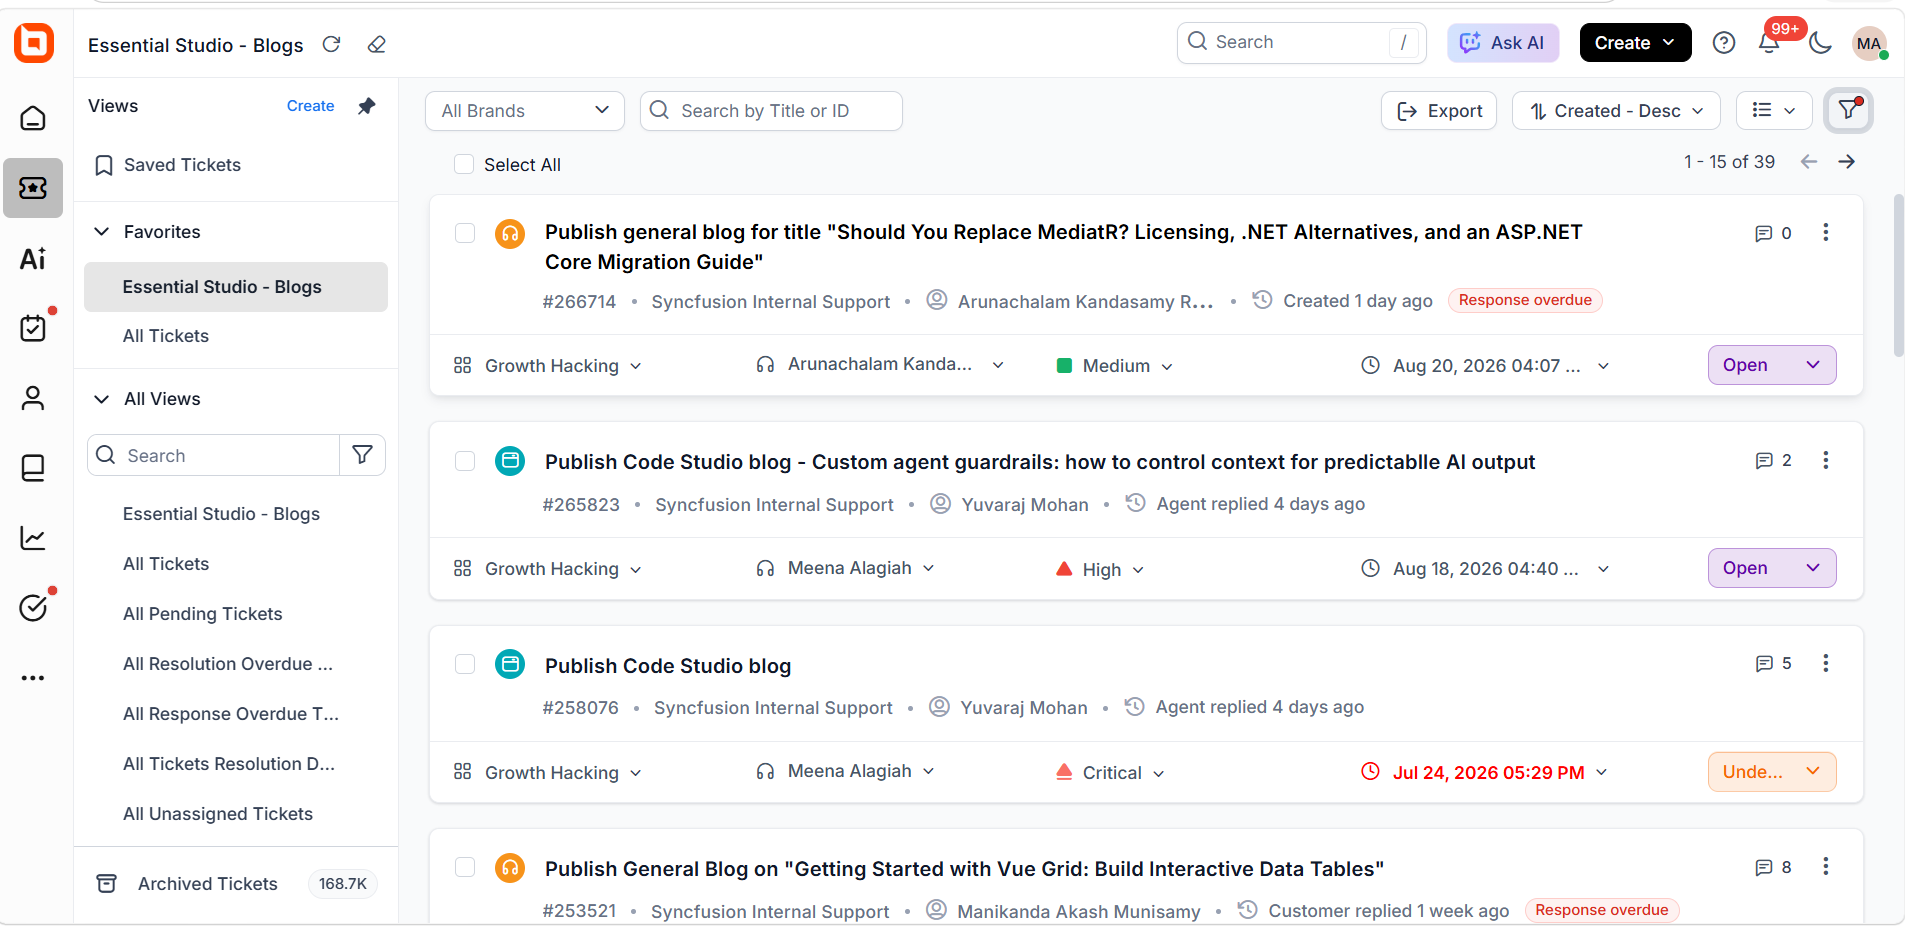
BoldDesk then adds the support-domain logic:
- Ticket status
- Priority
- Assignment
- Customer context
- SLA behavior
- Permissions
- Automation
- Support operations
The grid knows how to display and manipulate records. BoldDesk knows what those records mean.
Customer conversations
Support agents also need to communicate effectively with customers and coworkers.
Components such as:
can form part of the communication experience.
Together, they support rich replies, collaboration, mentions, and attachments.
Conceptually:
Rich Text Editor + Mention + File Upload → Customer communication
BoldDesk adds the surrounding product context: ticket history, collaboration rules, channels, customer information, and process state.
Support analytics and navigation
Charts and layout components help present operational information, while input, navigation, dialog, toolbar, and selection controls support the many smaller interactions found throughout a help-desk application.
Rather than building every interaction independently, product teams can compose reusable components into a consistent experience.
Developer takeaway: Large SaaS interfaces are often built from many focused components rather than one enormous domain-specific control.
The individual component solves a bounded UI problem. The product gives that interaction business meaning.
Bold BI: Building a complex analytics workspace
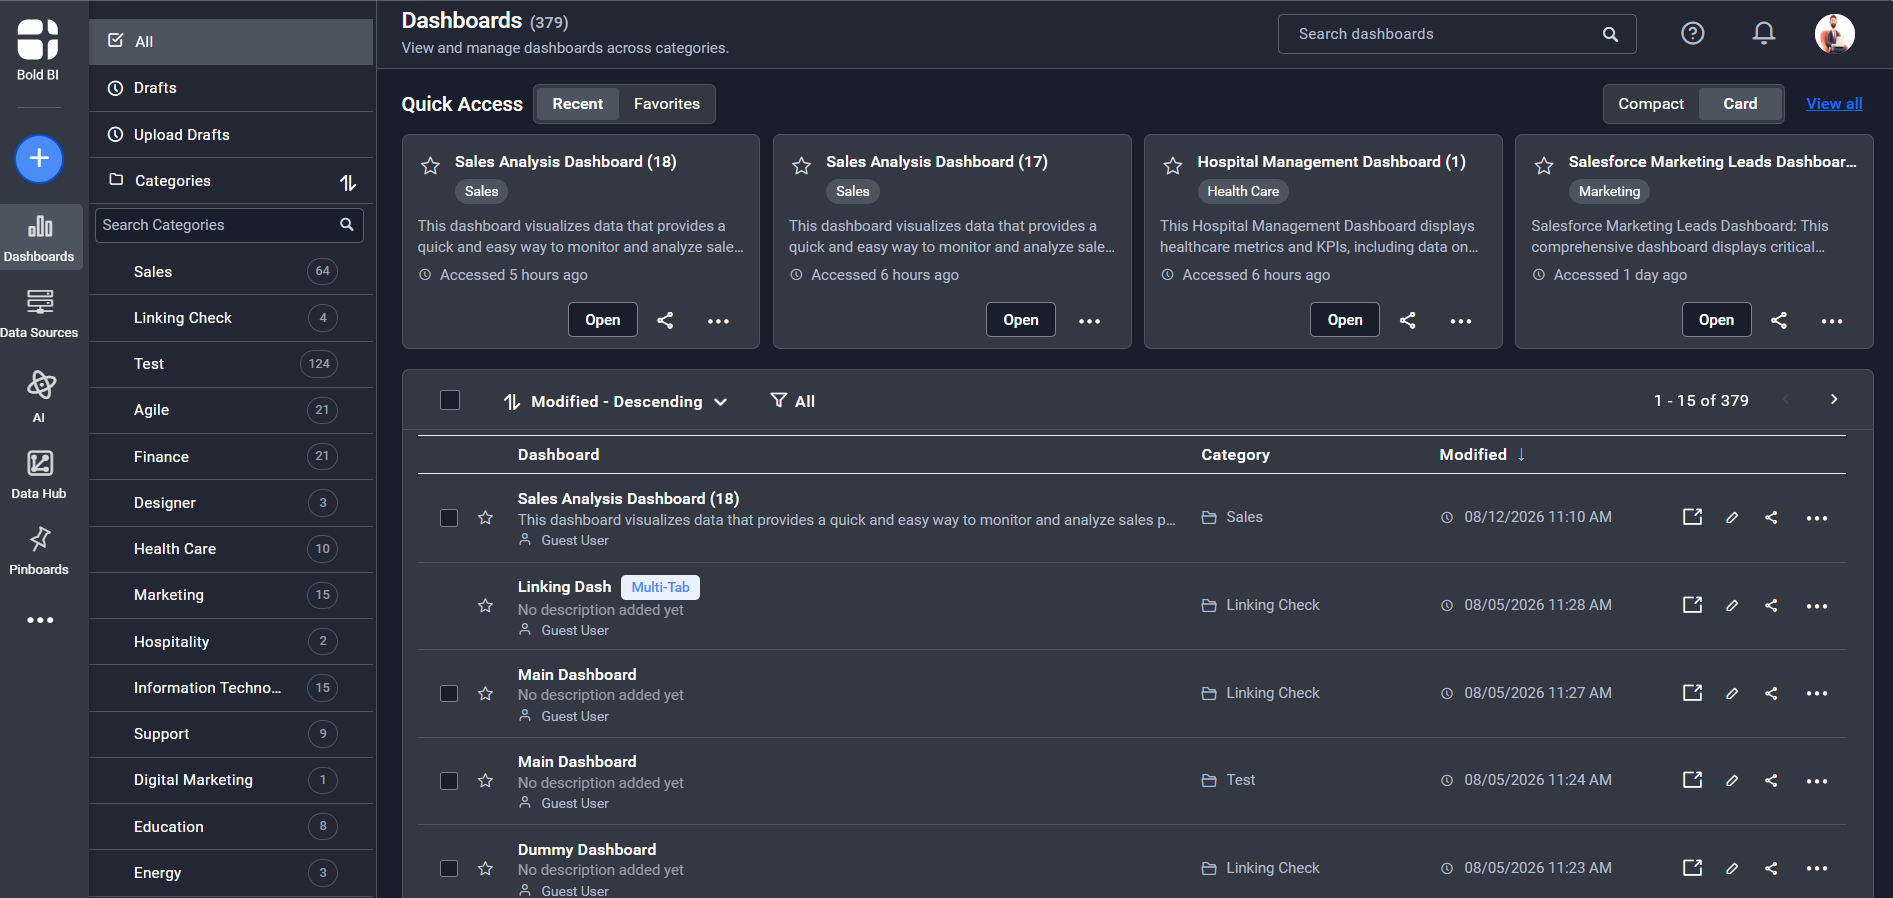
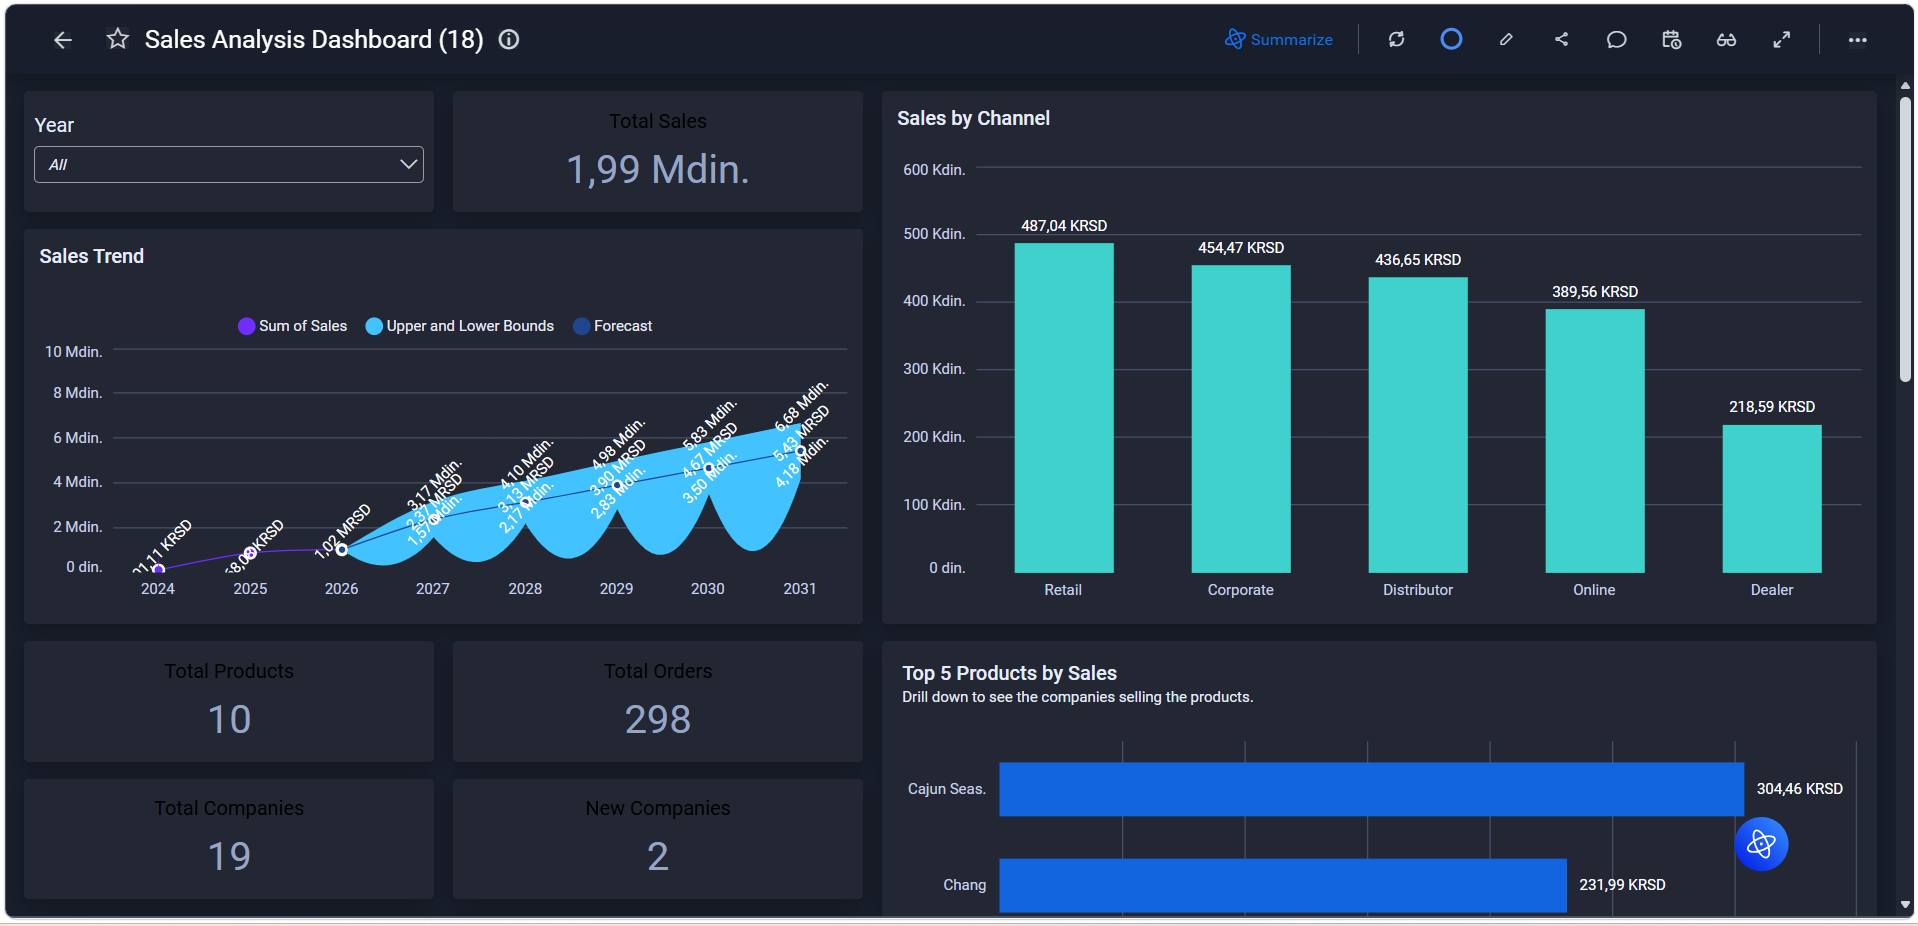
Analytics software introduces a different level of interaction density. A dashboard is not merely a page containing charts.
Users may need to:
- Connect to data
- Explore schemas
- Choose fields
- Add visualizations
- Drag and resize widgets
- Configure properties
- Apply filters
- Organize dashboards
- Manage users
- Share or embed analytics
A dashboard designer can therefore behave more like an interactive workspace than a static webpage.
Designer interactions
Controls such as:
can provide the interaction primitives needed to construct the designer environment.
Conceptually:
Toolbar + Menu + Tab + Splitter + drag-and-drop → Designer workspace
Bold BI then provides the analytics-specific layer:
- Dashboard models
- Data relationships
- Widget behavior
- Filtering
- Visualization semantics
- Sharing
- Embedding
- Governance
Data and schema management
Analytics applications also need to help users navigate data structures.
Components such as TreeView, DropDown Tree, AutoComplete, DataGrid, and ListBox can support data selection and exploration.
Conceptually:
Tree and grid controls + selection components → Data and schema management
The controls provide navigation and selection behavior. Bold BI determines what the data represents and how it contributes to an analysis.
Configuration-heavy interfaces
An analytics designer can expose a large number of settings.
Users may need to configure:
- Dimensions
- Measures
- Dates
- Colors
- Ranges
- Labels
- Number formats
- Filtering
- Sorting
- Interaction behavior
Reusable input components such as drop-down lists, check boxes, numeric inputs, date pickers, sliders, and color pickers can provide a consistent way to expose those settings.
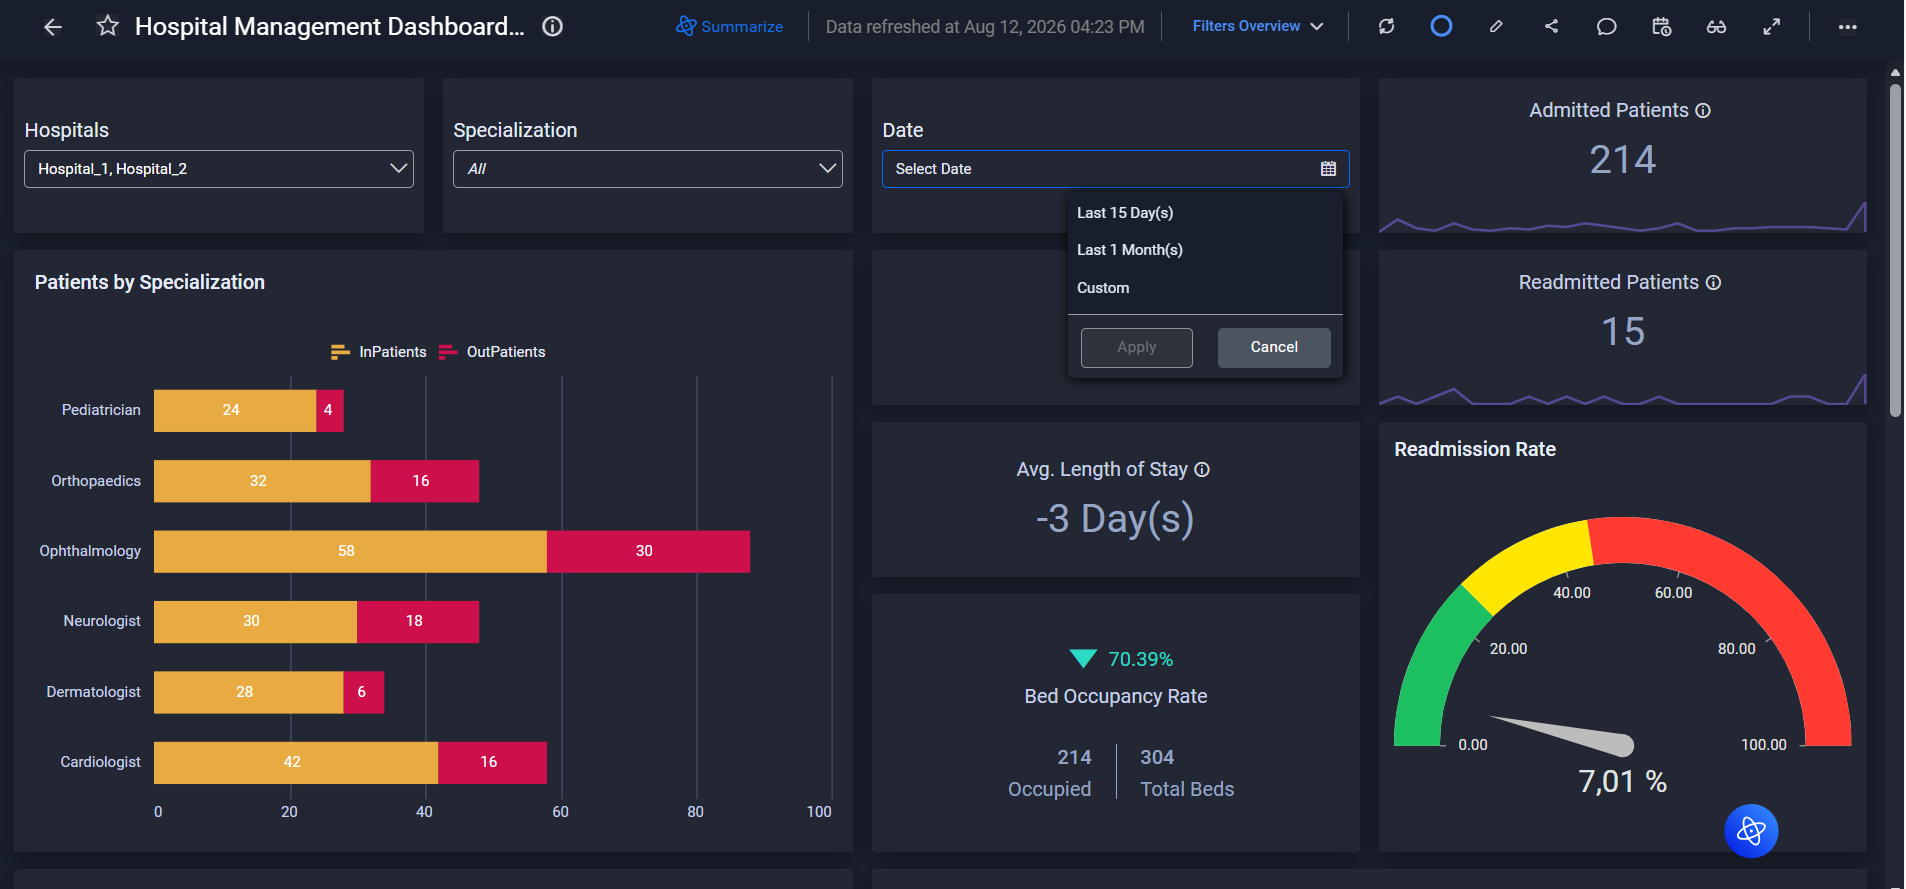
Developer takeaway: Reusable UI primitives become increasingly valuable as the number of coordinated interactions in an application grows.
A single control may be small. A consistent collection of them can form the interaction foundation of a sophisticated product.
Bold Reports: From report design to final output
Bold BI and Bold Reports both work with data, but their primary product experiences are different.
- Bold BI emphasizes interactive analytics and dashboards.
- Bold Reports focuses on reporting processes such as designing reports, configuring report elements, processing data, viewing output, and exporting or distributing finished reports.
A simplified reporting lifecycle looks like this:
Data source → Report definition → Design → Processing → Rendering → Export
Reusable technologies participate at several points in that experience.
Report configuration
Controls such as:
can support report-property configuration and image management.
Conceptually:
Input components + File Upload → Report configuration
Bold Reports then interprets those values as report-specific properties, parameters, formatting rules, and definitions.
Report structure and visualization
A TreeView can provide hierarchical navigation for report structures and elements.
Charts and gauges provide visualization building blocks.
Conceptually:
TreeView → Report hierarchy
and:
Charts + Gauges → Report visualization
Again, the reusable controls solve the interface and visualization problems.
Bold Reports provides the reporting semantics, processing model, data relationships, rendering behavior, and delivery operations around them.
Developer takeaway: Keep reusable UI primitives separate from domain-specific application semantics.
A TreeView should not need to understand a report definition. A chart should not need to understand how an enterprise reporting process is governed.
Clear boundaries make both the reusable technology and the product easier to evolve.
What four different products reveal about reusable technology
Looking across BoldSign, BoldDesk, Bold BI, and Bold Reports reveals a consistent pattern.
| Product requirement | Reusable technology | Product-specific responsibility |
| Structured data | Grids, filtering, selection | Domain models and processes |
| Rich communication | Rich Text Editor, mentions, uploads | Conversations and collaboration |
| Visualization | Charts, gauges, layouts | Metrics and business semantics |
| Document processing | PDF and document libraries | Signing and document processing |
| Hierarchical navigation | Tree controls | Product information architecture |
| Configuration | Input and selection controls | Validation and business rules |
| Designer experiences | Toolbars, layouts, interaction controls | Analytics or reporting models |
The underlying principle is straightforward:
Reusable components solve recurring engineering problems. Products create value by combining them with domain-specific behavior.
- A DataGrid does not need to know what a support ticket is.
- A PDF library does not need to know why a customer is signing a contract.
- A TreeView does not need to understand an analytics schema or report definition.
That separation is useful because it allows both layers to improve independently.
What we learn by using our own tools
Using shared developer technologies inside our own SaaS products creates another valuable dynamic. It puts those technologies into complete application environments.
That is different from testing a component only in isolation.
Components have to work together
Real product screens often contain several controls at once.
A workspace might include:
- A grid
- A dialog
- A toolbar
- Input controls
- Navigation
- An editor
- File upload
- Charts
This exposes integration questions that an isolated sample may not.
Do keyboard interactions remain predictable? Do overlays behave correctly? Are visual patterns consistent? Does the application stay responsive? Do the APIs compose naturally?
Performance becomes an application-level concern
A component can perform well in a focused demo.
A SaaS product introduces:
- Real datasets
- Multiple components
- Long user sessions
- Frequent API updates
- Complex navigation
- Real customer content
That environment creates another opportunity to evaluate how shared technologies behave under realistic application conditions.
Usability issues become easier to recognize
An API can be functionally correct while still being inconvenient to use.
Internal product teams encounter many of the same questions external developers do:
- Is the configuration intuitive?
- Is customization straightforward?
- Does a common scenario require too much code?
- Is an API missing an important hook?
- Is documentation clear enough?
- Does a default behavior work well inside a larger process?
Using shared technologies in complete applications provides another perspective on those questions.
Accessibility becomes a design concern
Accessibility is rarely limited to a single component.
A complete application must coordinate:
- Focus movement
- Keyboard navigation
- Dialog behavior
- Dynamic updates
- Error handling
- Screen-reader semantics
Using components together exposes accessibility considerations at the application level.
Framework and platform changes become real
Production applications have to keep moving.
Frameworks change. Browsers change. Dependencies change. Design requirements evolve.
A real SaaS product therefore provides another environment in which shared technologies experience ongoing integration and upgrade requirements.
That does not mean every request from an internal product automatically becomes an Essential Studio feature. Product-specific requirements should remain product-specific when appropriate.
The broader feedback loop looks like this:
Product requirement → Engineering challenge → Real-world evaluation → Potential technology improvement → Developer ecosystem
Internal products therefore become another source of practical experience alongside customer feedback, support cases, automated tests, documentation, samples, and product engineering.
Three lessons developers can apply to their own products
The same ideas apply beyond Syncfusion.
1. Reuse the primitives. Differentiate in the domain.
Applications contain both recurring technical problems and business-specific problems.
- A customer-support platform needs tables, editors, dialogs, and charts.
- An eSignature application needs document processing.
- An analytics application needs trees, inputs, and layout controls.
Those capabilities may be necessary, but they are not always where the product creates its unique value.
Using mature building blocks can allow a team to spend more time on its own operations, business rules, customer experience, and integrations.
2. Evaluate components inside real applications, not only demos.
A demo can tell you whether a component supports a feature.
A real application reveals different questions:
- Does it compose well?
- Is customization practical?
- Does it perform with real data?
- Is it accessible as part of a larger process?
- How does it behave on mobile?
- How difficult are framework upgrades?
- Can several components maintain a consistent experience together?
Evaluate libraries against representative product scenarios, not only feature matrices.
3. Design for composition.
Large applications are rarely built around one component.
They are systems of:
- Data displays
- Editors
- Forms
- Navigation
- Dialogs
- Visualization
- Document processing
- Interaction patterns
The more components an application uses, the more important consistency becomes.
Reusable components should therefore be judged not only by how much each one can do, but by how effectively they work together.
Look beyond the feature list
Framework support, APIs, performance, documentation, customization, accessibility, support, and licensing should absolutely be part of any component-library evaluation.
But they are not the only signals available.
Developers can also ask:
- Is this technology being used in substantial applications?
- Can different components work together to support complete business processes?
- Does the vendor encounter real integration and maintenance challenges while using its own technology?
- Has the technology been exercised outside carefully constructed demos?
No single answer determines whether a platform is right for your application. But first-hand product usage provides another useful perspective.
We use what we build
- A component demo can show whether a DataGrid sorts correctly.
- A sample can show whether a chart renders.
- Documentation can demonstrate how to configure an editor.
- An API reference can show how to process a PDF.
What those things cannot fully demonstrate is what happens when reusable technologies become part of products with their own users, processes, integrations, constraints, and years of continued development.
That is where internal product usage becomes valuable.
- BoldSign brings document-processing technologies into eSignature management.
- BoldDesk composes reusable UI technologies into a customer-support workspace.
- Bold BI brings interaction, data-management, and visualization components together around analytics.
- Bold Reports combines reporting, visualization, UI, and document technologies across report design and delivery.
Four products. Four different business problems. One shared technology ecosystem.
At Syncfusion, we do not only build tools for developers. We also use those tools while building products ourselves.




 No spam, just valuable updates.