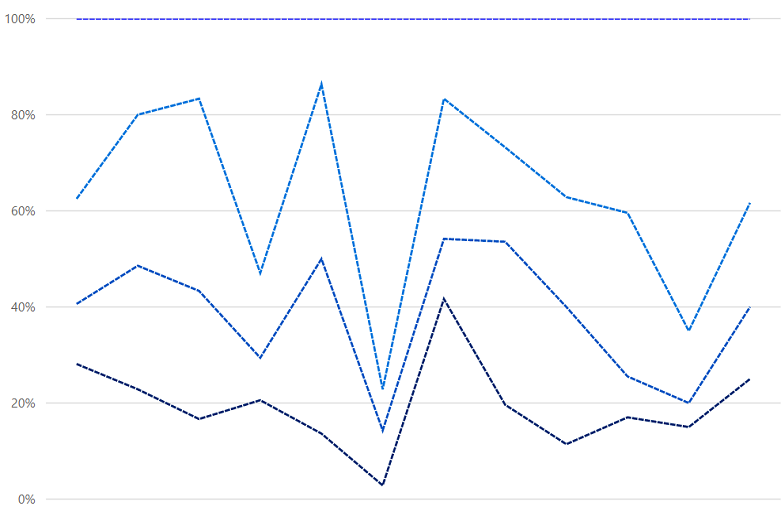
Overview
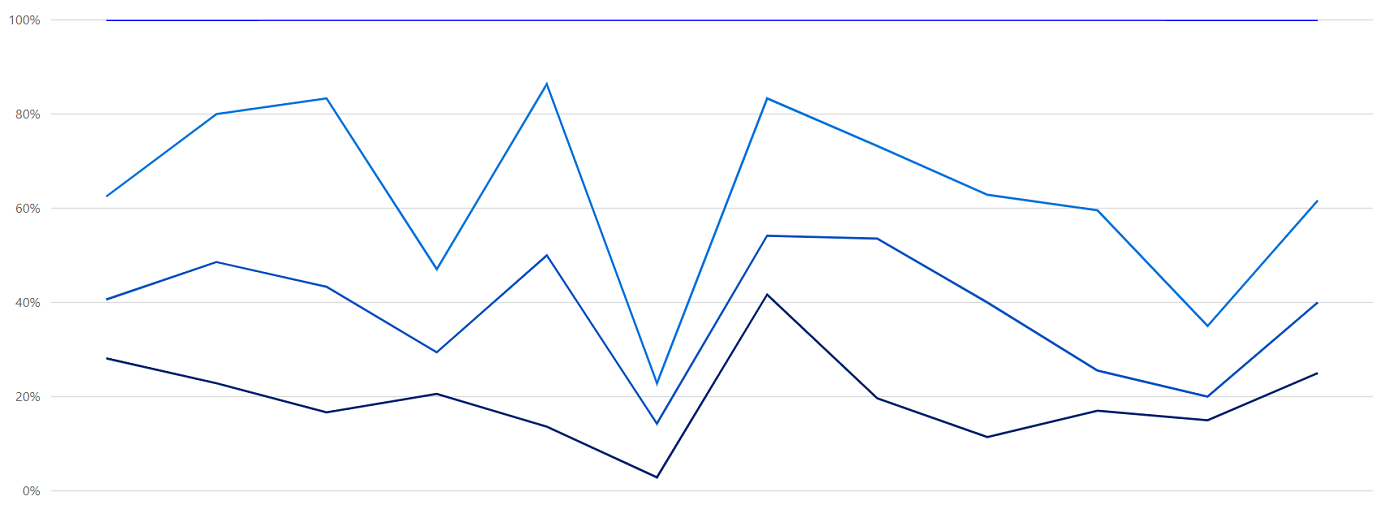
Angular 100% stacked line chart displays multiple series of data, ensuring that the cumulative proportion of each stacked element always totals 100%. Hence, the y-axis will always be rendered with the range 0–100.
Marker
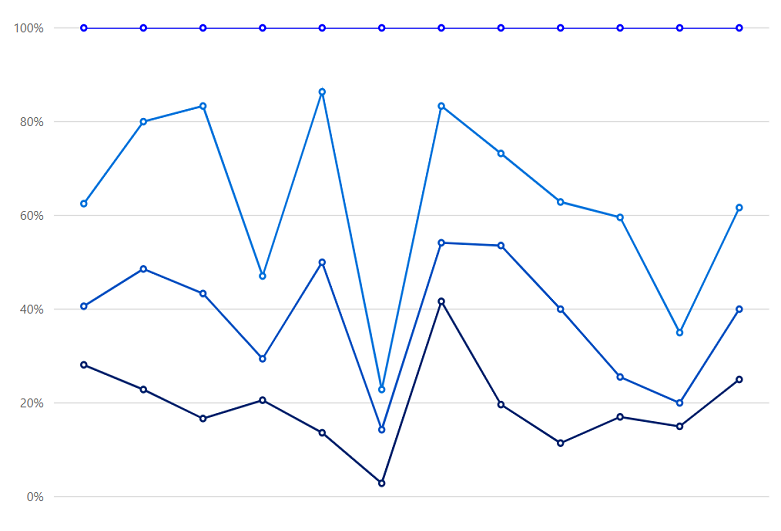
Marks data points with built-in shapes such as circles, rectangles, ellipses, vertical lines, horizontal lines, diamonds, triangles, pentagons, crosses, and pluses. In addition to these shapes, use images to make the point more attractive.
Data label
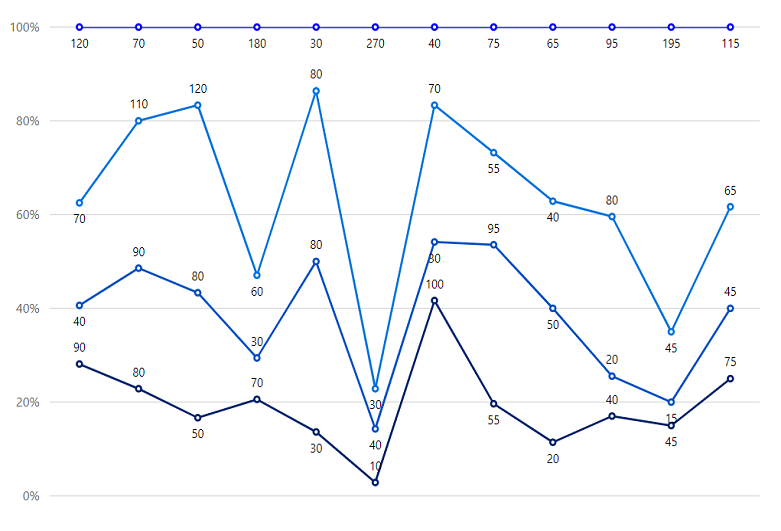
Data labels display information about data points. Add a template to display data labels with HTML elements such as images, DIV, and spans for more informative data labels. You can rotate a data label by its given angle.
Multiple axes
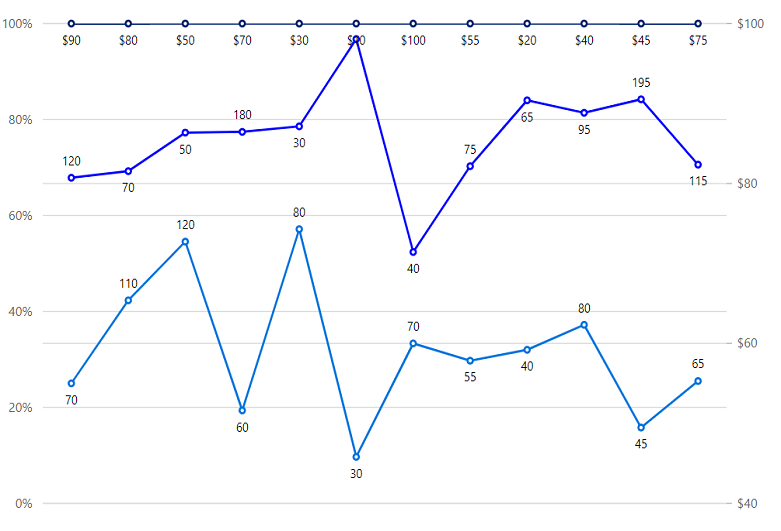
Use multiple axes to plot different data sets that widely vary from one other.
Customization
Customize the look and feel of the 100% stacked line chart using built-in APIs.
Code snippet
Easily get started with Angular 100% Stacked Line Chart using a few simple lines of HTML and TS code example as demonstrated below. Also explore our Angular 100% Stacked Line Chart Example that shows you how to render and configure the chart.
<ejs-chart style='display:block' id='chartcontainer'  [primaryXAxis]='primaryXAxis'>
<e-series-collection>
    <e-series [dataSource]='data' type='StackingLine100' xName='x' yName='y' name='John' width='2' [marker]='marker' dashArray='5,1'> </e-series>
    <e-series [dataSource]='data1' type='StackingLine100' xName='x' yName='y' name='Peter' width='2'
    [marker]='marker' dashArray='5,1'> </e-series>
    <e-series [dataSource]='data2' type='StackingLine100' xName='x' yName='y' name='Steve' width='2' [marker]='marker' dashArray='5,1'> </e-series>
    <e-series [dataSource]='data3' type='StackingLine100' xName='x' yName='y' name='Charle' width='2' [marker]='marker' dashArray='5,1'> </e-series>
</e-series-collection>
</ejs-chart>
import { Component } from '@angular/core';
export class AppComponent {
public data: Object[] = [
{ x: 'Food', y: 90 },
{ x: 'Transport', y: 80 },
{ x: 'Medical', y: 50 },
{ x: 'Clothes', y: 70 },
{ x: 'Personal Care', y: 30 },
{ x: 'Books', y: 10 },
{ x: 'Fitness', y: 100 },
{ x: 'Electricity', y: 55 },
{ x: 'Tax', y: 20 },
{ x: 'Pet Care', y: 40 },
{ x: 'Education', y: 45 },
{ x: 'Entertainment', y: 75 },
];
public data1: Object[] = [
{ x: 'Food', y: 40 },
{ x: 'Transport', y: 90 },
{ x: 'Medical', y: 80 },
{ x: 'Clothes', y: 30 },
{ x: 'Personal Care', y: 80 },
{ x: 'Books', y: 40 },
{ x: 'Fitness', y: 30 },
{ x: 'Electricity', y: 95 },
{ x: 'Tax', y: 50 },
{ x: 'Pet Care', y: 20 },
{ x: 'Education', y: 15 },
{ x: 'Entertainment', y: 45 },
];
public data2: Object[] = [
{ x: 'Food', y: 70 },
{ x: 'Transport', y: 110 },
{ x: 'Medical', y: 120 },
{ x: 'Clothes', y: 60 },
{ x: 'Personal Care', y: 80 },
{ x: 'Books', y: 30 },
{ x: 'Fitness', y: 70 },
{ x: 'Electricity', y: 55 },
{ x: 'Tax', y: 40 },
{ x: 'Pet Care', y: 80 },
{ x: 'Education', y: 45 },
{ x: 'Entertainment', y: 65 },
];
public data3: Object[] = [
{ x: 'Food', y: 120 },
{ x: 'Transport', y: 70 },
{ x: 'Medical', y: 50 },
{ x: 'Clothes', y: 180 },
{ x: 'Personal Care', y: 30 },
{ x: 'Books', y: 270 },
{ x: 'Fitness', y: 40 },
{ x: 'Electricity', y: 75 },
{ x: 'Tax', y: 65 },
{ x: 'Pet Care', y: 95 },
{ x: 'Education', y: 135 },
{ x: 'Entertainment', y: 115 },
];
//Initializing Primary X Axis
public primaryXAxis: Object = {
valueType: 'Category',
};
}import { ChartModule } from '@syncfusion/ej2-ng-charts';
import { StackingColumnLineService, CategoryService} from '@syncfusion/ej2-ng-charts';
import { AppComponent } from './app.component';
@NgModule({
declarations: [
AppComponent
],
imports: [
BrowserModule, ChartModule
],
providers: [ StackingLineSeriesService, CategoryService],
bootstrap: [AppComponent]
})
export class AppModule { }Learning Resources

100% Stacked Line Chart User Guide
Learn the available options to customize Angular 100% Stacked Line Chart.
