Overview
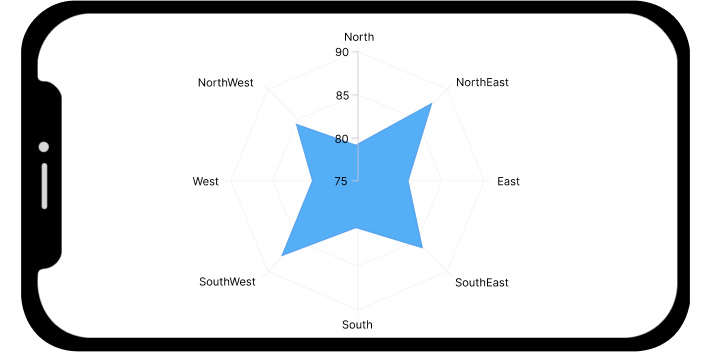
The .NET MAUI Radar area chart displays data points that are visualized as areas within a polygon gridline. This type of chart can be configured with numeric, category, date-time axes.
.NET MAUI Radar Area Chart documentation
Key features

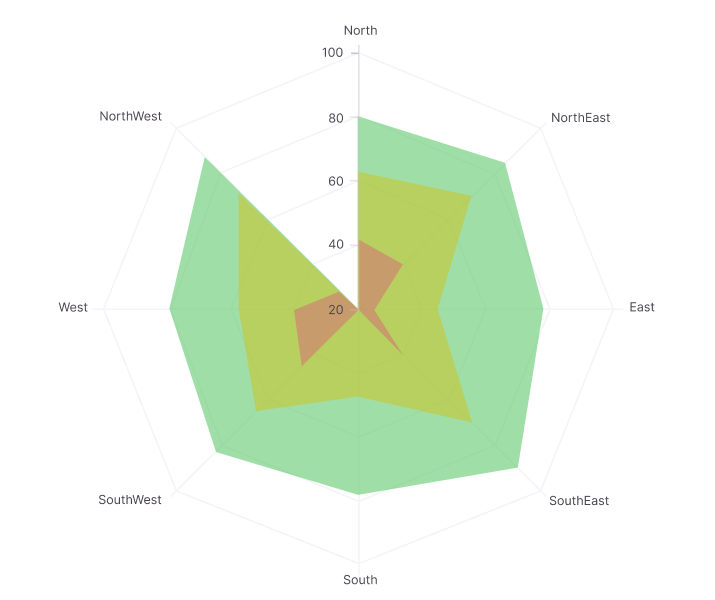
UI styling
Customize the color and border of the chart by utilizing the built-in APIs to create a visually distinctive appearance.
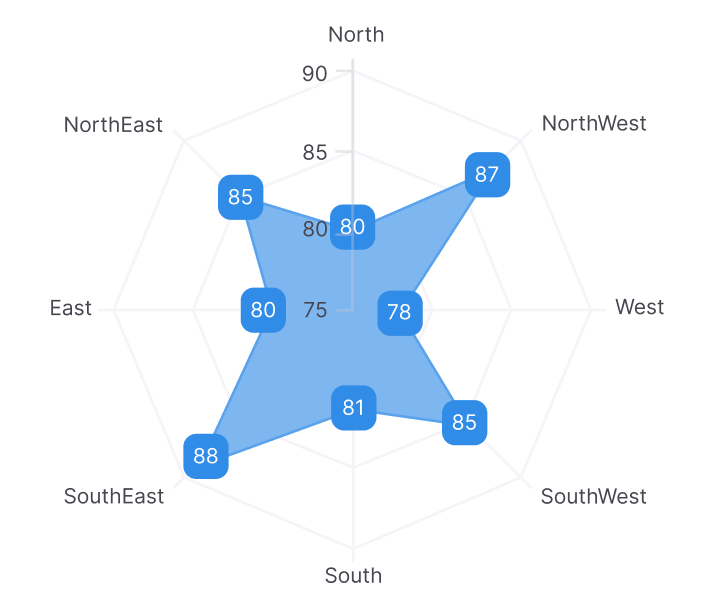
Data labels
Data labels display information about data points. Customize the foreground, border, and background of the labels. You can also rotate a data label to a specified angle.

Rendering position
Customize the start angle of a radar chart to visualize data from a different perspective.
Closing path
The series can be displayed with or without a closed path.
Code example
<ContentPage xmlns="http://schemas.microsoft.com/dotnet/2021/maui"
        xmlns:x="http://schemas.microsoft.com/winfx/2009/xaml"
        x:Class="ChartExample.MainPage"
        xmlns:local="clr-namespace:ChartExample"
        xmlns:chart="clr-namespace:Syncfusion.Maui.Charts;assembly=Syncfusion.Maui.Charts">

    <Grid>
        <chart:SfPolarChart HorizontalOptions="FillAndExpand" VerticalOptions="FillAndExpand" GridLineType="Polygon">
            <!--Setting BindingContext-->
            <chart:SfPolarChart.BindingContext>
                <local:ViewModel/>
            </chart:SfPolarChart.BindingContext>

            <!--Initialize the primary axis.-->
            <chart:SfPolarChart.PrimaryAxis>
                <chart:CategoryAxis/>
            </chart:SfPolarChart.PrimaryAxis>

            <!--Initialize the secondary axis.-->
            <chart:SfPolarChart.SecondaryAxis>
                <chart:NumericalAxis/>
            </chart:SfPolarChart.SecondaryAxis>

            <chart:SfPolarChart.Legend>
                <chart:ChartLegend/>
            </chart:SfPolarChart.Legend>

            <!--Adding series.-->
            <chart:PolarAreaSeries
                        ItemsSource="{Binding PlantDetails}"
                        XBindingPath="Direction"
                        YBindingPath="Tree"
                        Label="Tree">
            </chart:PolarAreaSeries>

            <chart:PolarAreaSeries
                        ItemsSource="{Binding PlantDetails}"
                        XBindingPath="Direction"
                        YBindingPath="Weed"
                        Label="Weed">
            </chart:PolarAreaSeries>

             <chart:PolarAreaSeries
                        ItemsSource="{Binding PlantDetails}"
                        XBindingPath="Direction"
                        YBindingPath="Flower"
                        Label="Flower">
            </chart:PolarAreaSeries>
        </chart:SfPolarChart>
    </Grid>
</ContentPage>
public class PlantData
{
public string Direction { get; set; }
public double Tree { get; set; }
public double Weed { get; set; }
public double Flower { get; set; }
public PlantData(string direction, double tree, double weed, double flower)
{
Direction = direction;
Tree = tree;
Weed = weed;
Flower = flower;
}
}
public class ViewModel
{
public ObservableCollection<PlantData> PlantDetails { get; set; }
public ViewModel()
{
PlantDetails = new ObservableCollection<PlantData>()
{
new PlantData(){ Direction = "North", Tree = 80, Weed = 63, Flower = 42},
new PlantData(){ Direction = "NorthEast", Tree = 85, Weed = 70, Flower = 40},
new PlantData(){ Direction = "East", Tree = 78 , Weed = 45, Flower = 25},
new PlantData(){ Direction = "SouthEast", Tree = 90 , Weed = 70, Flower = 40},
new PlantData(){ Direction = "South", Tree = 78 , Weed = 47, Flower = 20},
new PlantData(){ Direction = "SouthWest", Tree = 83 , Weed = 65, Flower = 45},
new PlantData(){ Direction = "West", Tree = 79 , Weed = 58, Flower = 40},
new PlantData(){ Direction = "NorthWest", Tree = 88 , Weed = 73, Flower = 28}
};
}
}Learning resources


.NET MAUI Radar Area Chart User Guide
Learn more about the available options for customizing the .NET MAUI radar area chart.
