ASP.NET Web Forms Bullet Graph Control
- Flexible and completely customizable.
- Replacement for meters and gauges.
- Supports features such as multiple measures, ranges, labels, indicators, caption, subtitle, etc.
Trusted by the world’s leading companies

Overview
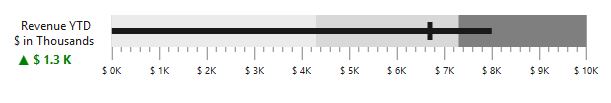
The ASP.NET Web Forms Bullet Graph control is used to visually compare the measures like the commonly used bar chart. The bullet graph displays one or more measures and compares those with other measures to enrich its meaning. You can also display the measures in a qualitative range of performance such as poor, satisfactory, and good.
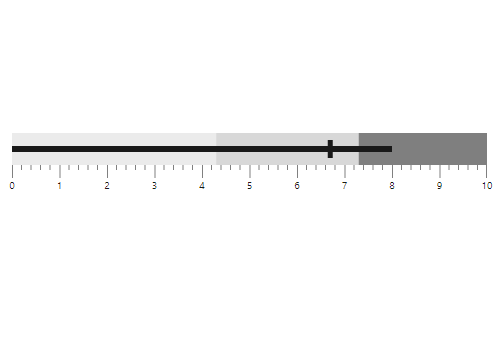
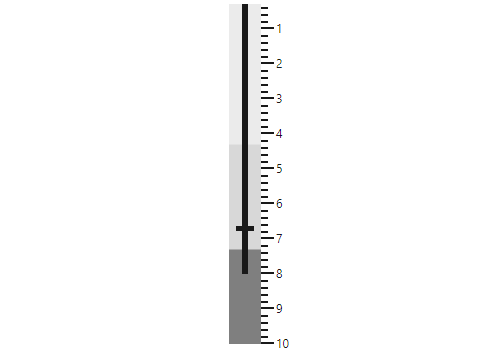
Orientation
Position the bullet graph either in vertical or horizontal orientation. This is helpful when viewing the gauge on mobile devices.
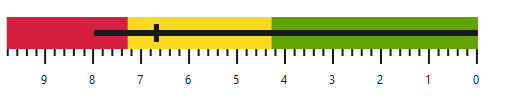
Flow Direction
Render the ASP.NET Web Forms Bullet Graph control either in forward or reverse direction.
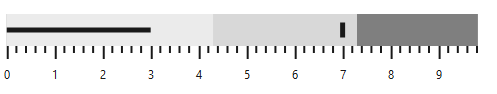
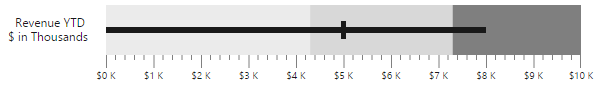
Comparative Measure
Comparative measure lines denote the current value and run perpendicular to the feature measure.
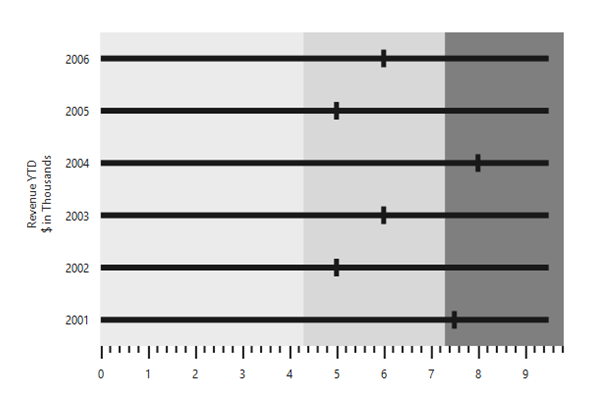
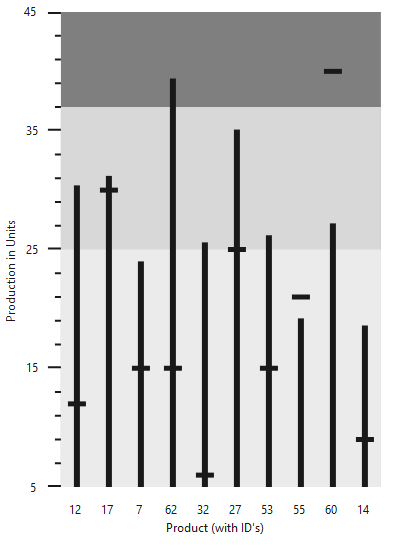
Multiple Measures
The ASP.NET Web Forms Bullet Graph control supports rendering of multiple measure bars as well as multiple comparative measure symbols to allow comparison of several measures at once.
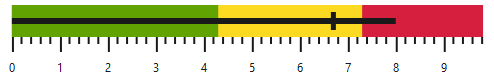
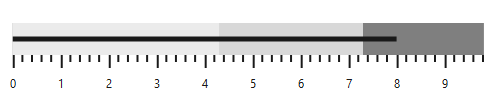
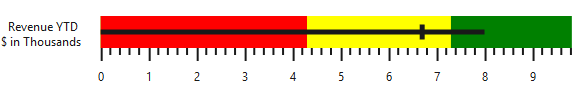
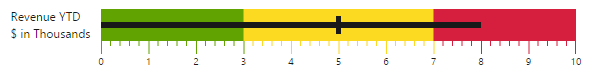
Qualitative Ranges
Qualitative range in a bullet graph helps measure the performance of data against a qualitative state by observing the distance between each range. Each color of the range represents a quality such as good, bad, and acceptable.
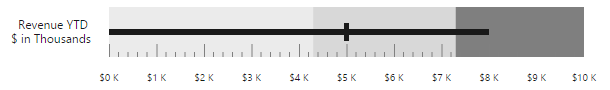
Quantitative Ticks
Display quantitative scale with two types of ticks. Major ticks are the primary scale indicators, and minor ticks are the secondary scale indicators that fall between the major ticks. You can apply the ranges color to both minor and major ticks that are associated with it.

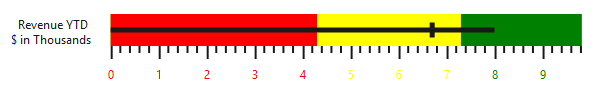
Labels
The labels in the ASP.NET Web Forms Bullet Graph control displays the numeric value according to the major ticks in the range of the scale. You can apply the range’s color to the labels that are associated with it.
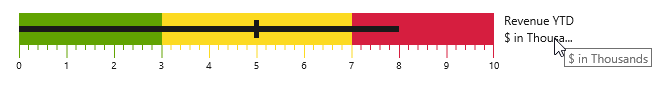
Tooltip
The interactive ASP.NET Web Forms Bullet Graph control provides options to display details about the measure through a tooltip when hovering the mouse over the measure.
Indicator
Displays a built-in symbol along with a text to indicate the state of current measure. You can also use images instead of symbols.
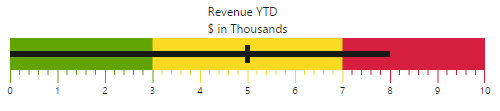
Caption and Subtitles
Caption and subtitle in the bullet graph control display additional information about the graph.
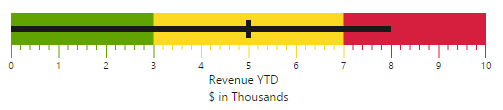
Text Placement
Place the text elements such as title, subtitle, and indicator text at any side of the scale. The text elements will trim if it overlaps with the scale.
75+ ASP.NET UI CONTROLS
ALL CONTROLS
GRIDS
DATA VISUALIZATION
DATA SCIENCE
EDITORS
NAVIGATION
NOTIFICATION
BUSINESS INTELLIGENCE
Our Customers Love Us
Having an excellent set of tools and a great support team, Syncfusion® reduces customers’ development time.Here are some of their experiences.

We chose Essential Studio based on the breadth and quality of the components and the excellent support.
I would highly recommend using Essential Studio and have found that the Syncfusion support team is one of the fastest I have worked with.
Rated by users across the globe
Syncfusion ASP.NET Resources
Learning
 Documentation
 Documentation


Awards
Greatness—it’s one thing to say you have it, but it means more when others recognize it. Syncfusion® is proud to hold the following industry awards.

