Waterfall Chart in Essential Studio® Flutter
Overview
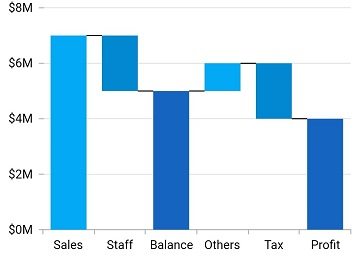
The Flutter waterfall chart explains gradual changes in the quantitative value of an entity that is subject to changes by increments or decrements. Using the waterfall chart, you can quickly illustrate changes in revenues. You can create beautiful, animated, real-time and high-performance waterfall chart that also supports the interactive features such as zooming and panning, trackball, crosshair, tooltip and selection.

Key features
Total and intermediate sum
Calculates the sum of previous data points and displays the value as a new column in the Flutter waterfall chart.
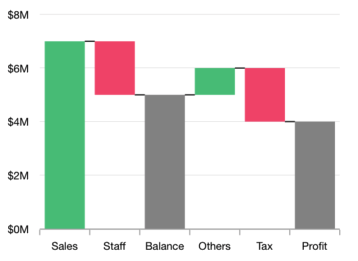
UI customization
Customize the positive, negative, and summary segment colors of the Flutter Waterfall Chart by using built-in APIs to make it visually unique.
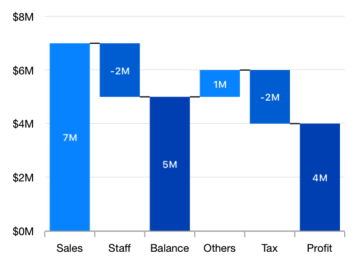
Data labels
Data points can easily be annotated with data labels to improve readability.
Learning resources


Flutter Waterfall Chart User Guide
Learn available options to customize the Flutter Waterfall Chart.
