We use cookies to give you the best experience on our website. If you continue to browse, then you agree to our privacy policy and cookie policy.

The Flutter Range Area Chart is used to display continuous data points as a set of lines that varies between high and low values over intervals of time and across different categories. You can create beautiful, animated, real-time and high-performance range area chart that also supports the interactive features such as zooming and panning, trackball, crosshair, tooltip and selection.

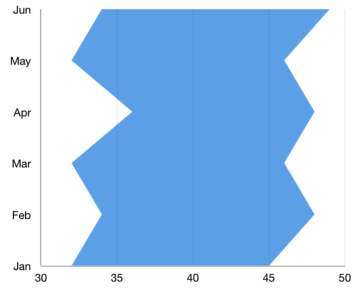
The Flutter Range Area Chart can be transposed vertically to view data from a different perspective.
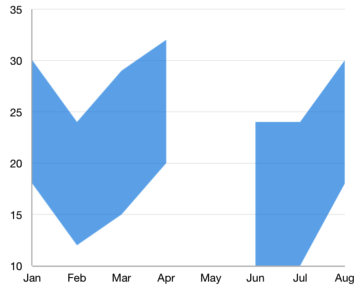
The Flutter Range Area Chart handles empty or null data points elegantly.
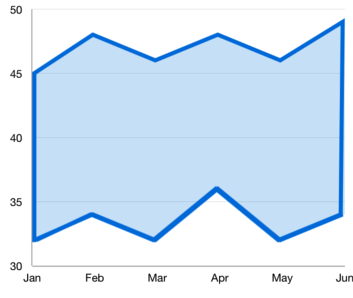
Customizes the color and thickness of the range area chart using built-in APIs to make it visually unique.

Flutter Range Area Chart User Guide
Learn available options to customize the Flutter Range Area Chart.
 You are using an outdated version of Internet Explorer that may not display all features of this and other websites. Upgrade to Internet Explorer 8 or newer for a better experience.

