Flutter Radial Bar Chart - Create Beautiful Circular Bar Chart
Overview
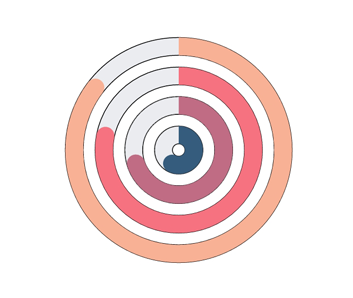
The Flutter Radial Bar Chart is ideal for rendering circular bars and comparing values between various categories. You can create beautiful, animated, real-time and high-performance radial bar chart that also supports the interactive features such as tooltip and selection.

Key features

Custom radius
You can customize both the inner and outer radius of the chart to make it precisely the size you need.

Corner style
Customize the start and end of the Flutter radial bar segments by rendering flat or curved corners.
Customization
Customize the look and feel of the Flutter Radial Bar Chart using built-in APIs.
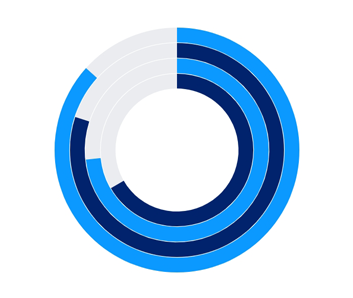
Palette color
Set desired palette colors to the radial bar chart’s segments.
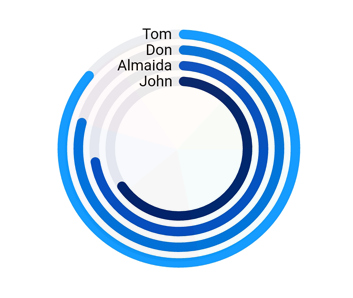
Smart labels
Smartly hide overlapping data labels when data point values fall close together.
Code example
Easily get started with the Flutter OHLC (Open High Low Close) Chart using a few simple lines of DART code example as demonstrated below,
import 'package:flutter/material.dart';
import 'package:syncfusion_flutter_charts/charts.dart';

@override
    Widget build(BuildContext context) {
        return Scaffold(
            body: Center(
                child: Container(
                    child: SfCircularChart(
                        series: <CircularSeries>[
                            // Renders radial bar chart
                            RadialBarSeries<ChartData, String>(
                                dataSource: chartData,
                                xValueMapper: (ChartData data, _) => data.x,
                                yValueMapper: (ChartData data, _) => data.y
                            )
                        ]
                    )
                )
            )
        );
    }
Learning resources


Flutter Radial Bar Chart User Guide
Learn about the available options to customize the Flutter Radial Bar Chart.
