Flutter OHLC Chart - Highly Customizable, Easy-to-Use Chart
Overview
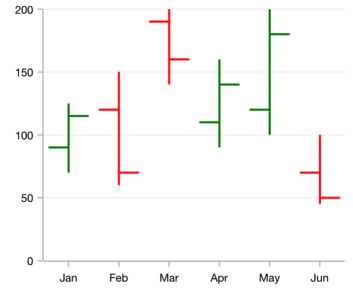
The Flutter OHLC Chart is like a candle chart. The horizontal lines at the left and right are used to show open and close values of the stock, and the vertical line represents high and low values. You can create beautiful, animated, real-time and high-performance OHLC chart that also supports the interactive features such as zooming and panning, trackball, crosshair, tooltip and selection.

Key features
Bull and bear
Customizable bull and bear colors.

Zooming and scrolling
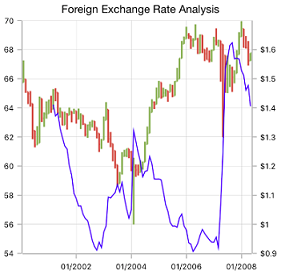
The Flutter OHLC Chart Supports zooming and panning when dealing with large amount of data to visualize data point in any region.
Technical indicators
Supports analyzing historical data and predicting future price movements using technical indicators.
Code example
Easily get started with the Flutter OHLC (Open High Low Close) Chart using a few simple lines of DART code example as demonstrated below,
import 'package:flutter/material.dart';
import 'package:syncfusion_flutter_charts/charts.dart';

@override
    Widget build(BuildContext context) {
        return Scaffold(
            body: Center(
                child: Container(
                    child: SfCartesianChart(
                        primaryXAxis: DateTimeAxis(),
                        series: <CartesianSeries<SalesData, DateTime>>[
                            // Renders hiloOpenCloseSeries
                            HiloOpenCloseSeries<SalesData, DateTime>(
                                dataSource: chartData,
                                xValueMapper: (SalesData sales, _) => sales.year,
                                lowValueMapper: (SalesData sales, _) => sales.low,
                                highValueMapper: (SalesData sales, _) => sales.high,
                                openValueMapper: (SalesData sales, _) => sales.open,
                                closeValueMapper: (SalesData sales, _) => sales.close,

                            )
                        ]
                    )
                )
            )
        );
    }
Learning resources


Flutter Open High Low Close (OHLC) Chart User Guide
Learn available options to customize the Flutter OHLC Chart.
