Overview
The Flutter Box and Whisker Chart is used to visualize a group of numerical data through their quartiles. It is also referred as box plot chart. Box plots may also have lines extending vertically from the boxes (whiskers) indicating variability outside the upper and lower quartiles. You can create beautiful, animated, real-time and high-performance box and whisker chart that also supports the interactive features such as zooming and panning, trackball, crosshair, tooltip and selection.

Key features
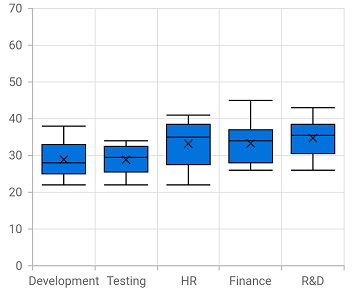
Box plot mode
The Flutter Box and Whisker Chart supports different types of rendering mode such us exclusive, inclusive, and normal.

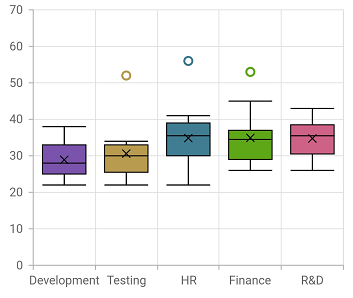
Outlier
Represent the values beyond the minimum and maximum values of the data. The outlier is usually represented by a circle in the Flutter Box and Whisker Chart.

Show mean
The Flutter box-and-whisker chart allows you to enable or disable displaying the average value of the box plot.
Customization
Customize the color of the box plot and outliers by using APIs to make them visually unique. The box plot can be customized with a gradient color.
Code example
Easily get started with the Flutter Box and Whisker Chart using a few simple lines of DART code example as demonstrated below,
import 'package:flutter/material.dart';
import 'package:syncfusion_flutter_charts/charts.dart';

void main() {
  return runApp(_ChartApp());
}

class _ChartApp extends StatelessWidget {
  @override
  Widget build(BuildContext context) {
    return MaterialApp(
      theme: ThemeData(primarySwatch: Colors.blue),
      home: _MyHomePage(),
    );
  }
}

class _MyHomePage extends StatefulWidget {
  // ignore: prefer_const_constructors_in_immutables
  _MyHomePage({Key? key}) : super(key: key);

  @override
  _MyHomePageState createState() => _MyHomePageState();
}

class _MyHomePageState extends State<_MyHomePage> {
  late List<_ChartData> data;
  late TooltipBehavior _tooltip;

  @override
  void initState() {
    data = [
      _ChartData(
        'CHN',
        [12, 22, 22, 23, 25, 25, 25, 26, 27, 27, 28, 28, 29],
      ),
      _ChartData(
        'GER',
        [22, 24, 25, 30, 32, 34, 36, 38, 39, 41, 40, 56],
      ),
      _ChartData(
        'RUS',
        [26, 27, 28, 30, 32, 34, 35, 37, 35, 37, 45],
      ),
      _ChartData(
        'BRZ',
        [21, 26, 27],
      ),
      _ChartData(
        'IND',
        [26, 27, 29, 32, 34, 35, 36, 37, 38, 39, 41, 43, 58],
      )
    ];
    _tooltip = TooltipBehavior(enable: true);
    super.initState();
  }

  @override
  Widget build(BuildContext context) {
    return Scaffold(
        appBar: AppBar(
          title: const Text('Syncfusion Flutter chart'),
        ),
        body: SfCartesianChart(
            primaryXAxis: CategoryAxis(),
            primaryYAxis: NumericAxis(minimum: 0, maximum: 40, interval: 10),
            tooltipBehavior: _tooltip,
            series: <CartesianSeries<_ChartData, String>>[
              BoxAndWhiskerSeries<_ChartData, String>(
                  dataSource: data,
                  xValueMapper: (_ChartData data, _) => data.x,
                  yValueMapper: (_ChartData data, _) => data.y,
                  name: 'Gold',
                  color: Color.fromRGBO(8, 142, 255, 1))
            ]));
  }
}

class _ChartData {
  _ChartData(this.x, this.y);

  final String x;
  final List<double> y;
}
Learning resources


Box and Whisker Chart User Guide
Learn available options to customize the Flutter Box and Whisker Chart.
