Try Our Live Demo
Add deeper analytical context to chart data
Use fitted trend models, financial indicators, and highlighted reference regions to explain data behavior, assess market activity, and draw attention to important values.
Reveal trends and patterns
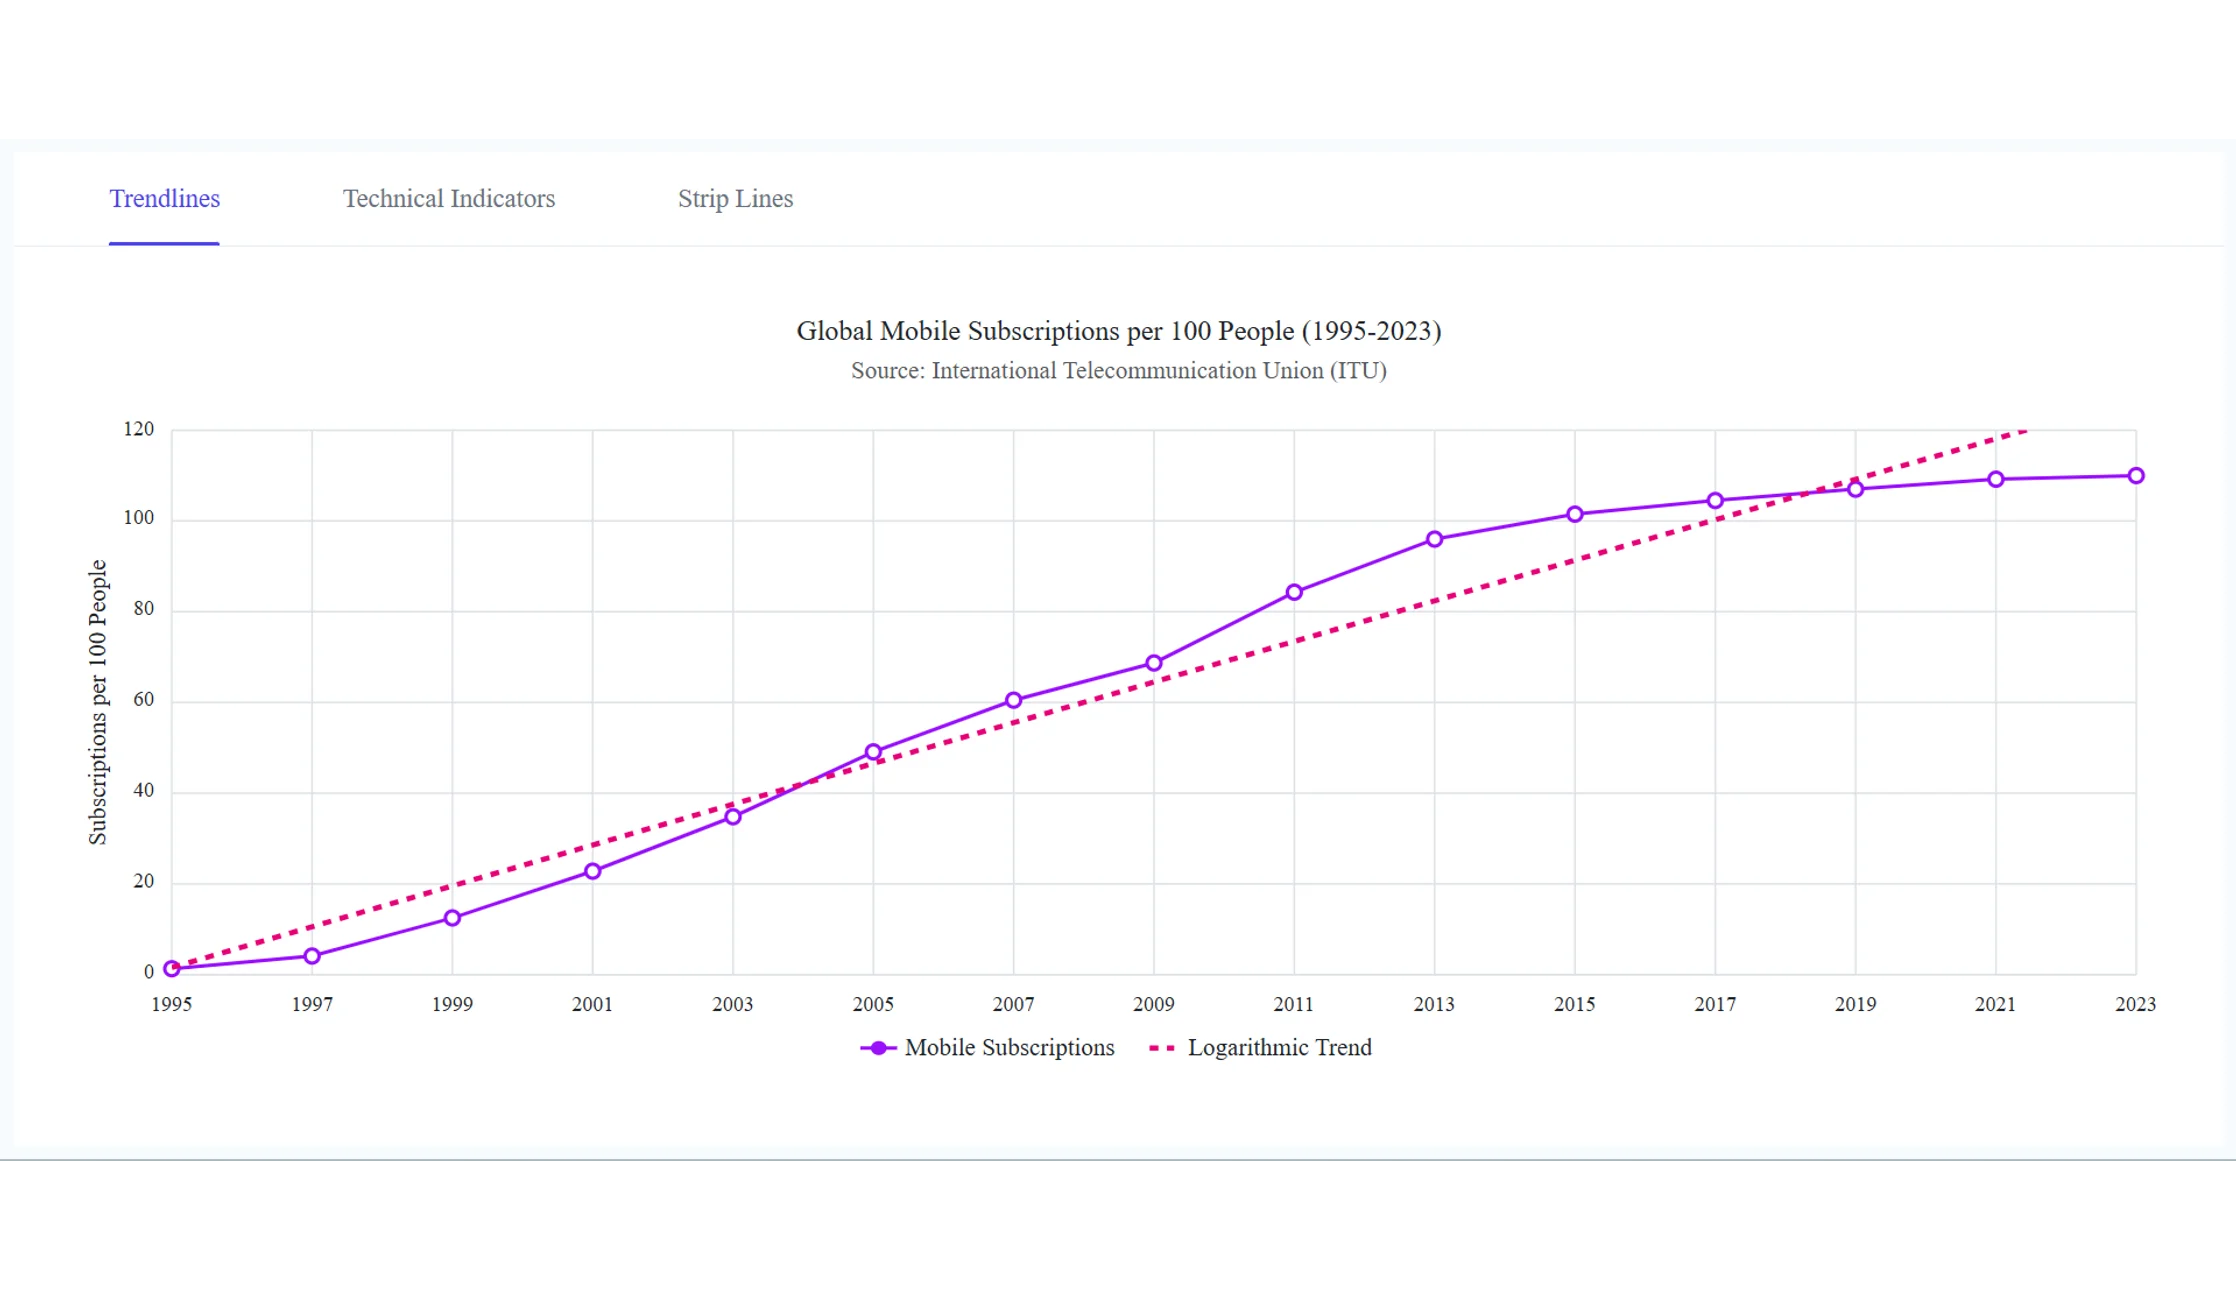
Apply linear, exponential, logarithmic, polynomial, power, and moving average trendlines to understand patterns and estimate future values.
Evaluate financial signals
Use 10 built-in technical indicators to study price trends, momentum, volatility, reversal zones, and buying or selling pressure.
Emphasize important ranges
Add horizontal or vertical strip lines and bands to mark targets, thresholds, time intervals, categories, and reference boundaries.
Analyze patterns and forecast values with Trendlines
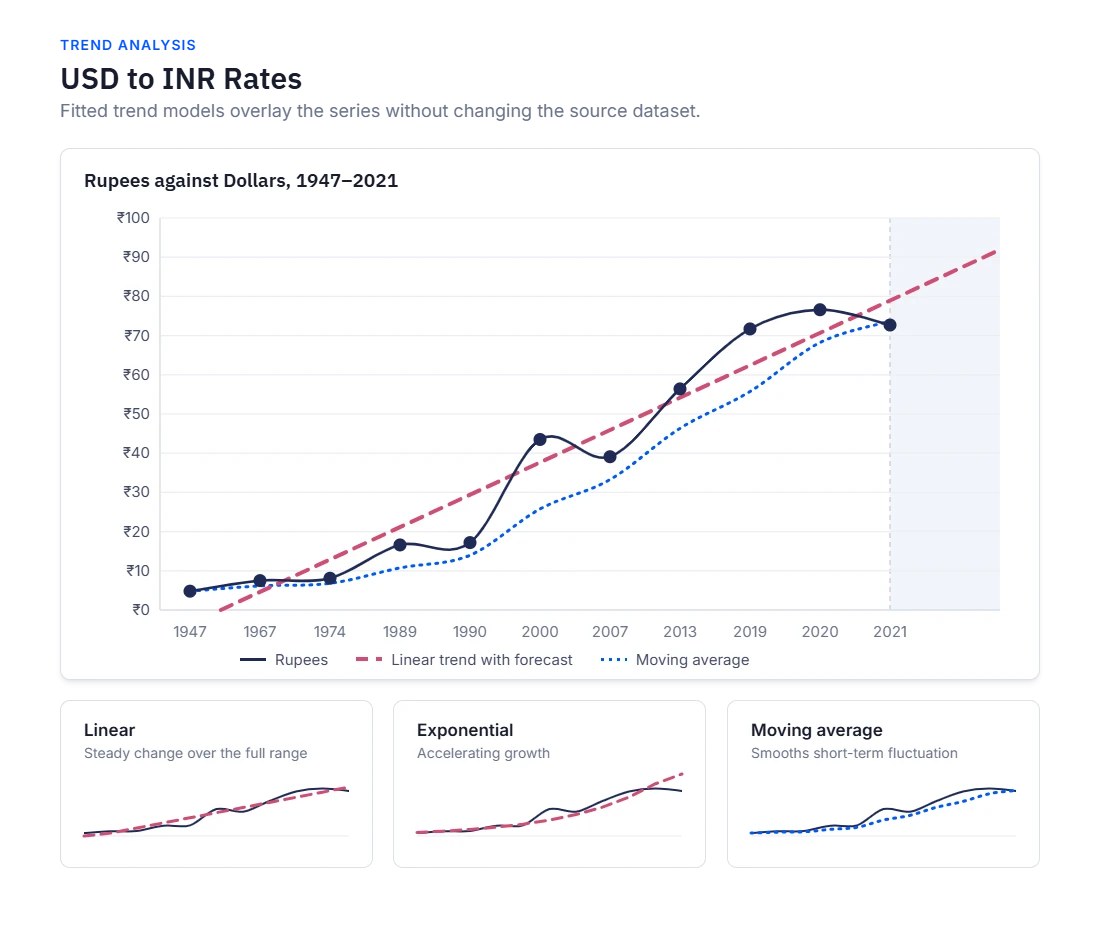
Add fitted trend models to line, scatter, area, column, and financial charts without changing the source dataset. Compare models, smooth fluctuations, and extend trendlines to estimate future or past values.
- Choose linear, exponential, logarithmic, polynomial, power, or moving average models.
- Match the trendline to steady, accelerating, slowing, fluctuating, proportional, or volatile data.
- Overlay multiple trendlines to compare model fit and configure forecast ranges.
- Ensure analytical consistency when reviewing patterns across large data collections.
Analyze financial markets with Technical Indicators
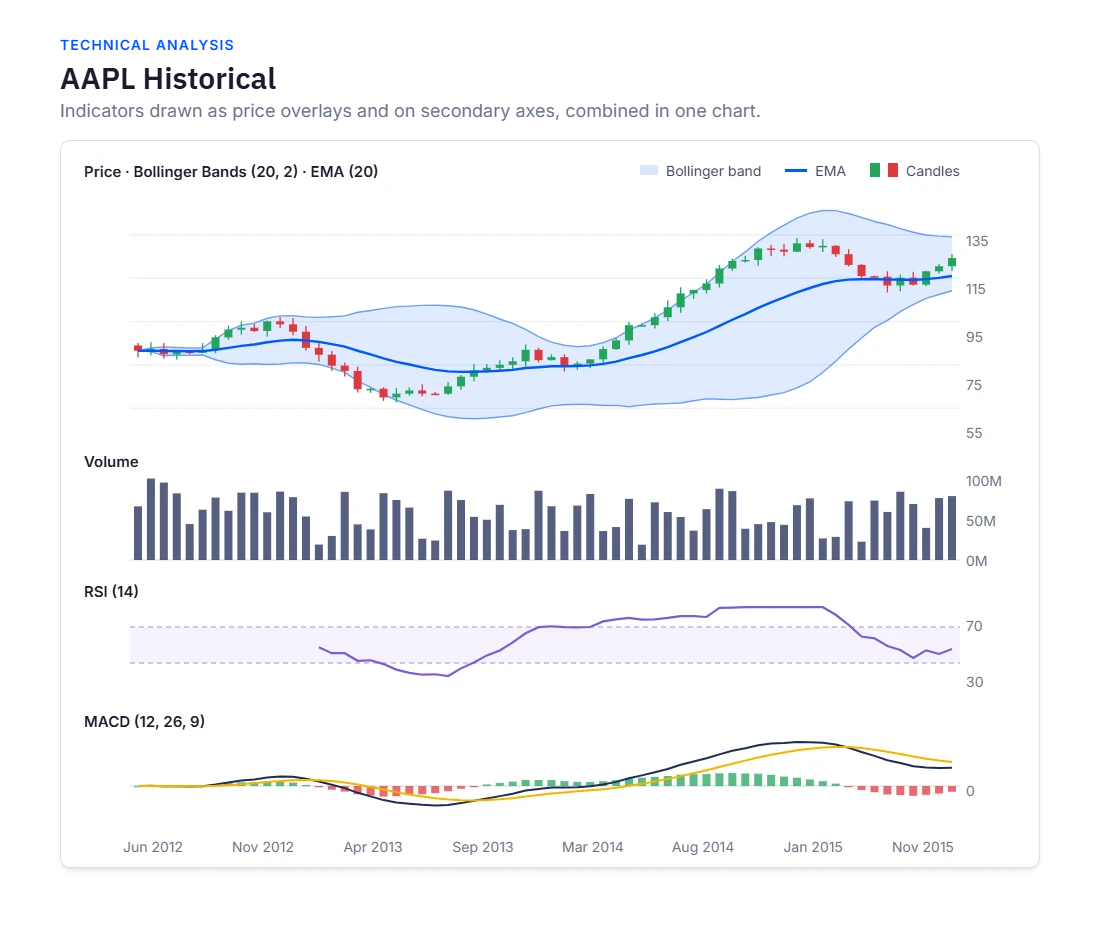
Apply 10 built-in indicators to candlestick and OHLC charts. Render indicators as price overlays or on secondary axes, customize their appearance, and combine multiple indicators for layered technical analysis.
- Analyze trends with SMA, EMA, and TMA, and evaluate volatility with Bollinger Bands and ATR.
- Measure momentum and reversals with RSI, MACD, Stochastic, and Momentum indicators.
- Assess price and volume relationships with Accumulation Distribution and customize indicator zones and styling.
- Ensure comprehensive signal analysis by combining multiple indicators in one chart.
Highlight ranges and thresholds with Strip Lines
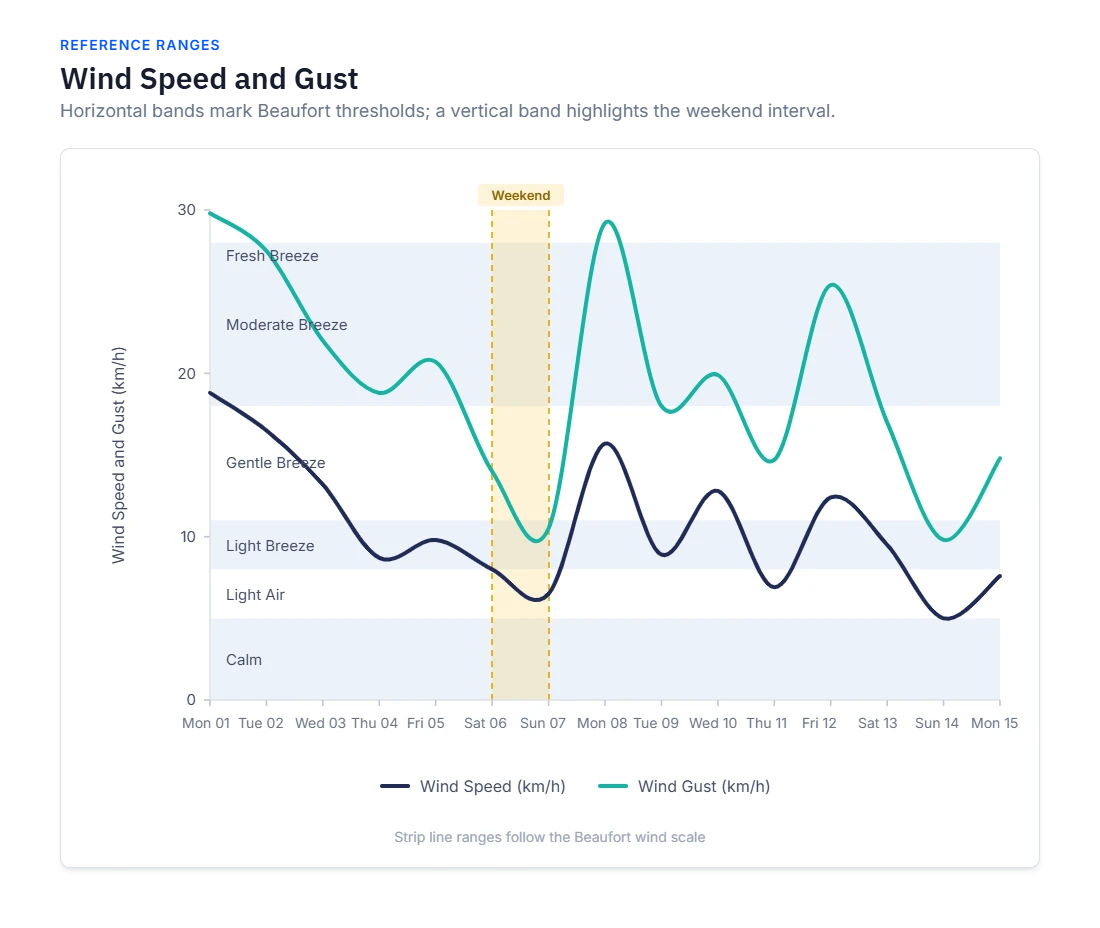
Display horizontal or vertical lines and bands across the plotting area to emphasize value ranges, boundaries, targets, and reference intervals. Customize strip line appearance and text for application-specific context.
- Use horizontal strip lines to mark target bands and thresholds at y-axis positions.
- Use vertical strip lines to highlight categories, time intervals, and x-axis boundaries.
- Customize strip line color, placement, size, and labels to communicate each highlighted region.
- Ensure faster interpretation of critical chart regions across analytical reports.
Frequently Asked Questions
What capabilities are included in Advanced Analytics?
Advanced Analytics includes Trendlines for pattern and forecast analysis, Technical Indicators for financial analysis, and Strip Lines for highlighting chart ranges, boundaries, and thresholds.
Can trendlines forecast future values?
Yes. Trendlines can extend beyond existing points to estimate future values and can also extend backward to approximate historical trends.
Can multiple Technical Indicators be shown on one chart?
Yes. Multiple indicators can be configured independently and displayed as overlays on the price series or on secondary axes to provide additional financial insight.
Which trendline models are available?
Syncfusion Charts supports linear, exponential, logarithmic, polynomial, power, and moving average trendlines for different data shapes and analytical requirements.
Which Technical Indicators are available for financial analysis?
Available indicators include SMA, EMA, TMA, Bollinger Bands, ATR, RSI, MACD, Stochastic, Momentum, and Accumulation Distribution for trend, volatility, momentum, and volume analysis.
When should horizontal or vertical Strip Lines be used?
Use horizontal Strip Lines for y-axis targets, thresholds, and reference ranges. Use vertical Strip Lines for x-axis categories, time intervals, and reference boundaries.
Resources
Learn more about Advanced Analytics
Explore demos, KB articles, and documentation to get the most out of Trendlines, Technical Indicators, and Strip Lines.
Explore guides, setup details, and quick-start tips
See live use cases in action
Ask, share, and connect with peers
Find solutions and best practices fast.
Get expert help when needed.
Feature requests and bug reports
Track issues and suggest improvements
Awards
Greatness—it’s one thing to say you have it, but it means more when others recognize it. Syncfusion® is proud to hold the following industry awards.