Try Our Live Demo
Choose the right indicator for market analysis
Choose from 10 built-in indicators, including SMA, EMA, Bollinger Bands, MACD, and RSI, and apply them to candlestick and OHLC data without restructuring the dataset.
Identify trends using SMA indicators
Simple Moving Average smooths short-term fluctuations to highlight overall trend direction.
Track market changes using EMA
Exponential Moving Average responds quickly to recent price changes for faster trend confirmation.
Analyze volatility using Bollinger Bands
Bollinger Bands use moving average and standard deviation to visualize expanding and contracting price movement.
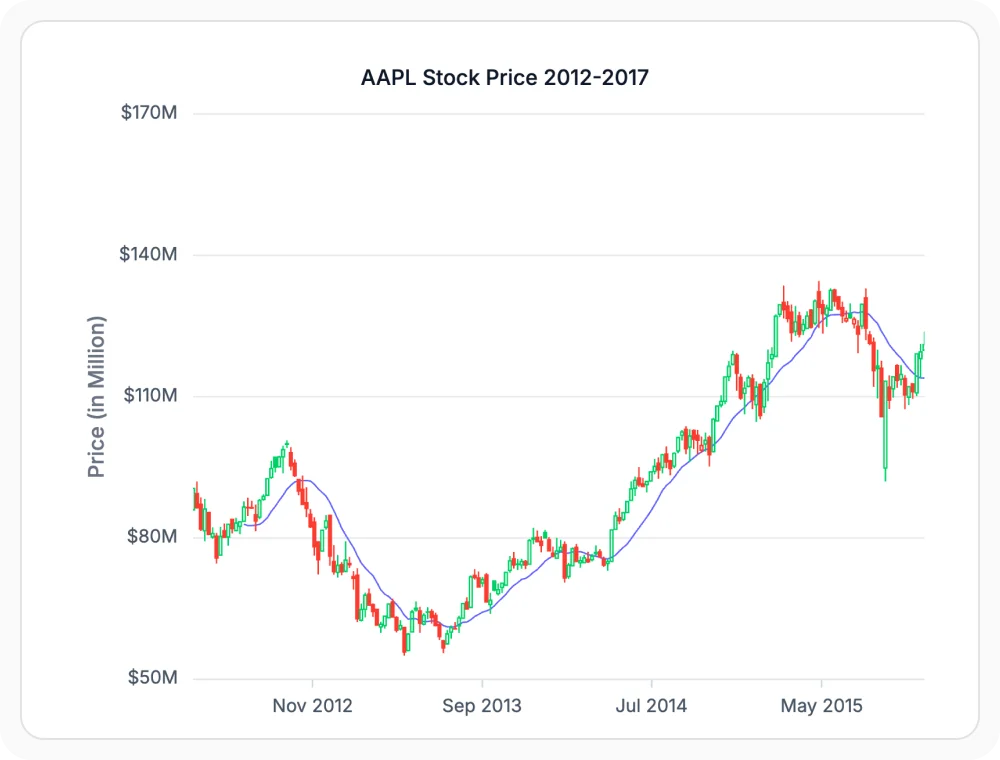
Identify trends using SMA indicators
SMA calculates the average price over a specified number of periods, smoothing short-term fluctuations to highlight overall trend direction. Use it when long-term trends must be identified, since the average smooths short-term volatility and forms the basis for trend-following strategies.
- Smooth short-term price fluctuations with averaging over N periods.
- Highlight overall trend direction on candlestick or OHLC charts.
- Serve as a foundation for trend-following strategies.
- Combine with other indicators for layered technical analysis.
Track market changes using EMA
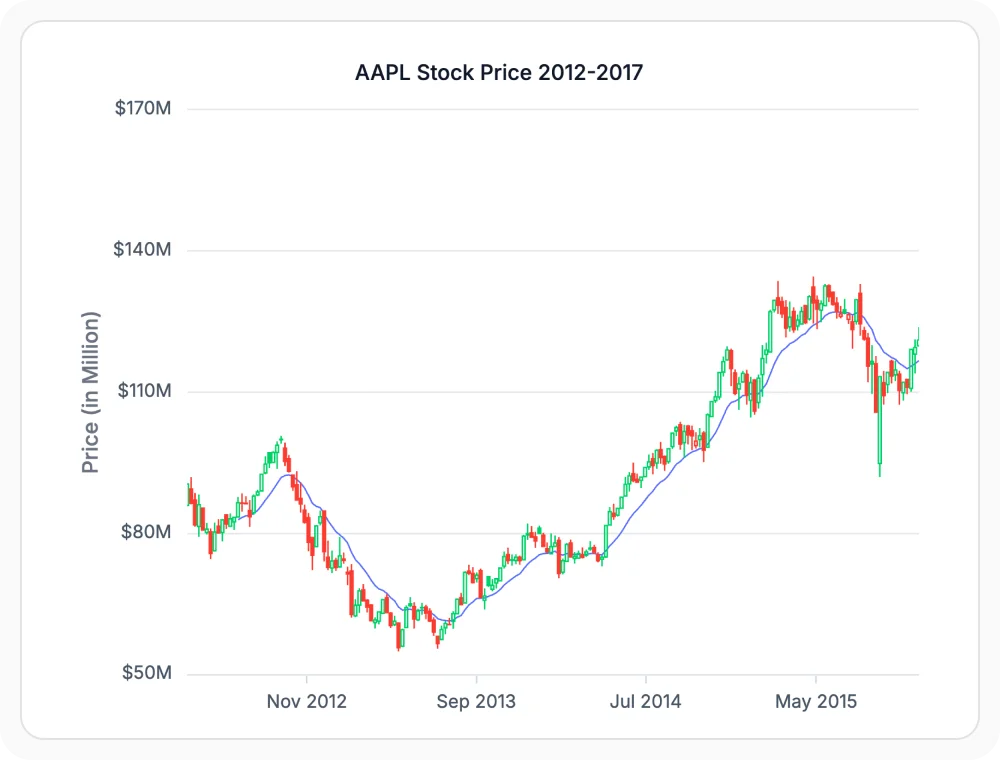
EMA gives greater weight to recent price data than SMA. Use it when faster trend confirmation is needed, since the indicator responds more quickly to recent movements and detects momentum shifts.
- Apply greater weight to recent price data than SMA does.
- Respond more quickly to market movements and momentum shifts.
- Generate timely trading signals in fast-changing markets.
- Combine with slower indicators for momentum confirmation.
Analyze volatility using Bollinger Bands
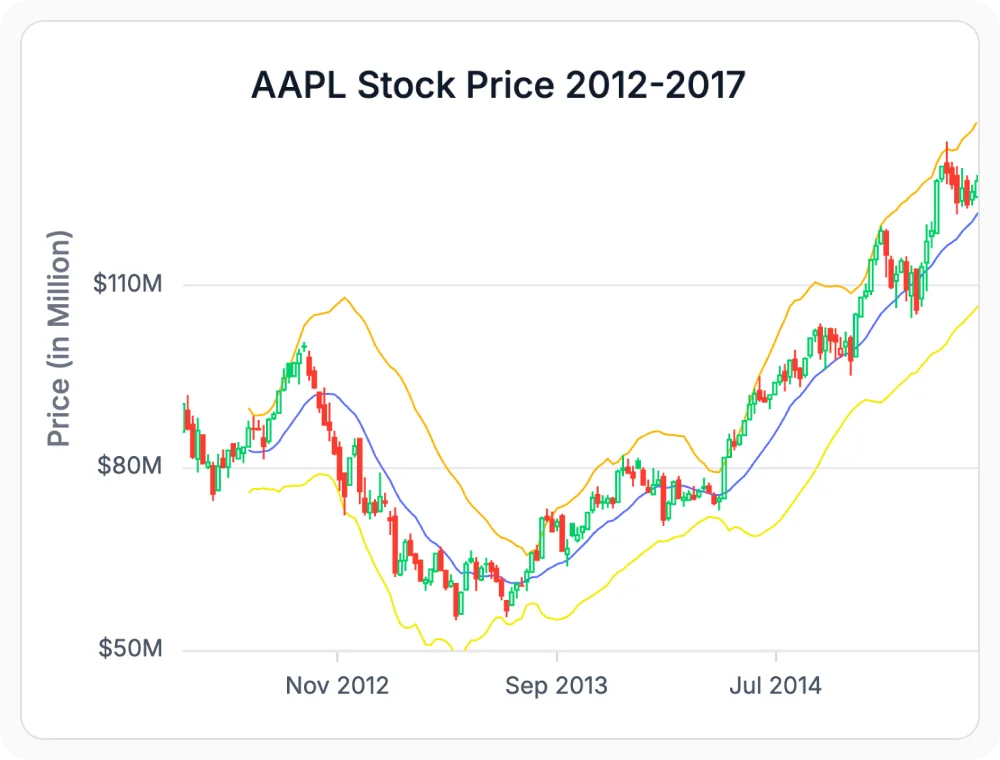
Bollinger Bands use a moving average and standard deviation to create upper and lower bands. Use them when volatility must be analyzed, since the bands adapt to expanding and contracting price movement and surface overbought, oversold, or breakout conditions.
- Display upper and lower bands based on moving average and standard deviation.
- Visualize expanding and contracting periods of volatility.
- Detect overbought and oversold market conditions.
- Identify potential breakout scenarios quickly.
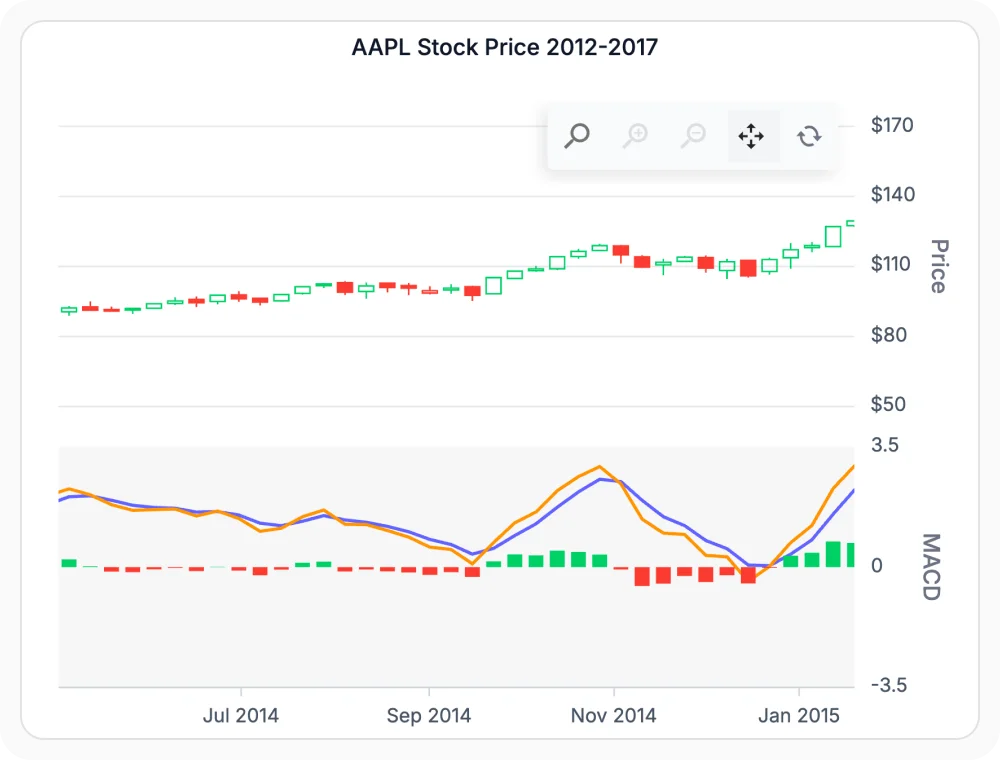
Identify momentum shifts using MACD
MACD compares two exponential moving averages to measure trend strength and momentum. Use it for momentum analysis, since the MACD line, signal line, and histogram help identify trend reversals.
- Compare two exponential moving averages to measure trend strength.
- Display MACD line, signal line, and histogram together.
- Identify momentum changes and potential reversal points.
- Confirm trends and detect early warning signs of reversal.
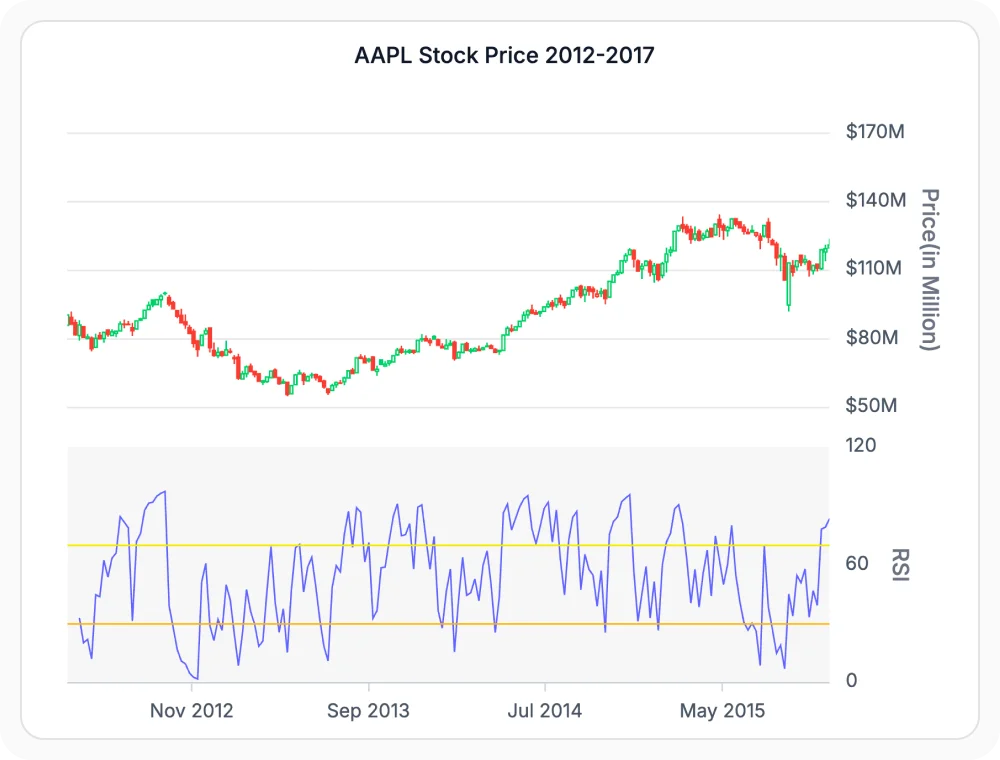
Analyze momentum using RSI indicators
RSI measures the speed and magnitude of recent price changes. Use it when overbought or oversold conditions must be identified, since the 0 to 100 oscillation supports momentum evaluation.
- Measure speed and magnitude of recent price changes.
- Highlight overbought and oversold conditions with 0 to 100 oscillation.
- Evaluate momentum strength and reversal zones.
- Use showZones to color overbought and oversold regions.
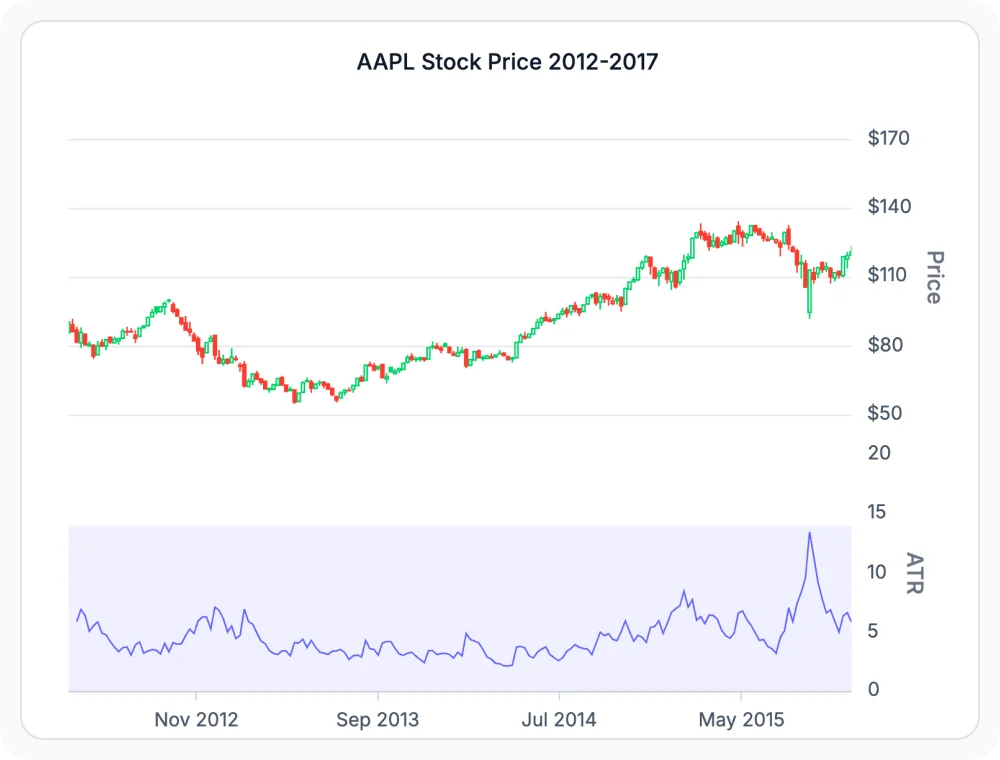
Measure volatility using ATR indicators
ATR measures market volatility by comparing current and previous trading ranges. Use it when volatility must be quantified, since the indicator captures activity levels and risk for volatility-based strategies.
- Measure market volatility from current and previous trading ranges.
- Quantify risk independent of price direction.
- Support volatility-based trading strategies.
- Manage position sizing and stop levels based on volatility.
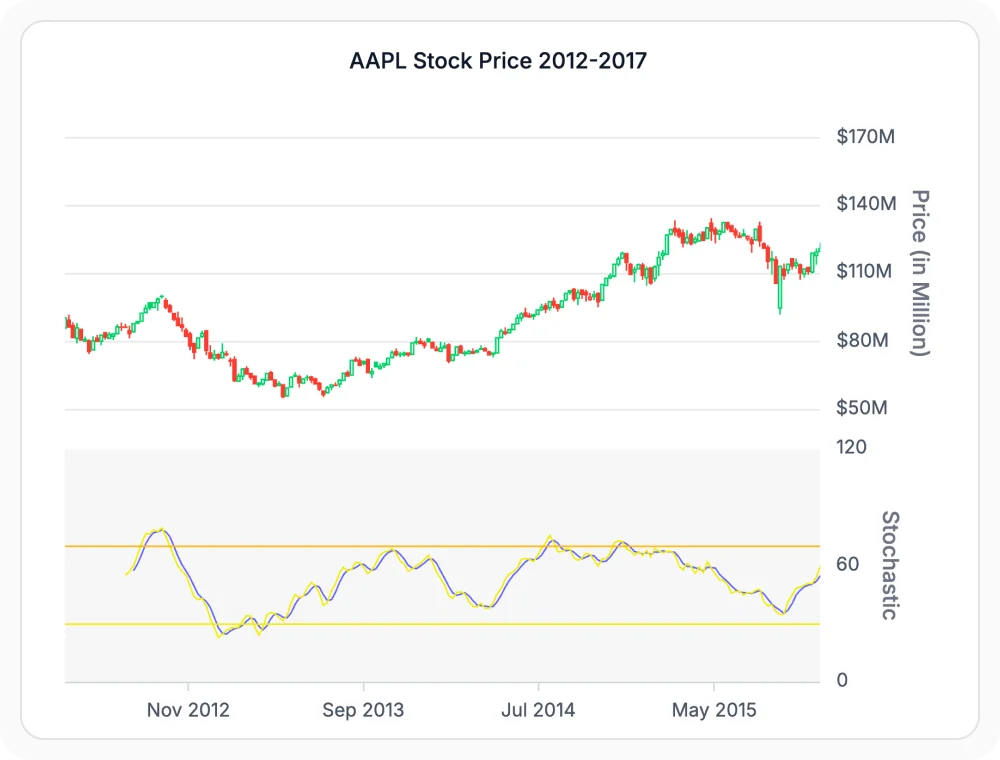
Identify reversals using Stochastic oscillator
The Stochastic Oscillator compares a security’s closing price to its recent trading range. Use it when momentum turning points must be identified, since thresholds above 80 and below 20 highlight overbought and oversold conditions.
- Compare closing price to recent trading range for momentum.
- Highlight overbought (above 80) and oversold (below 20) zones.
- Identify potential turning points and reversal signals.
- Use showZones to visually mark momentum extremes.
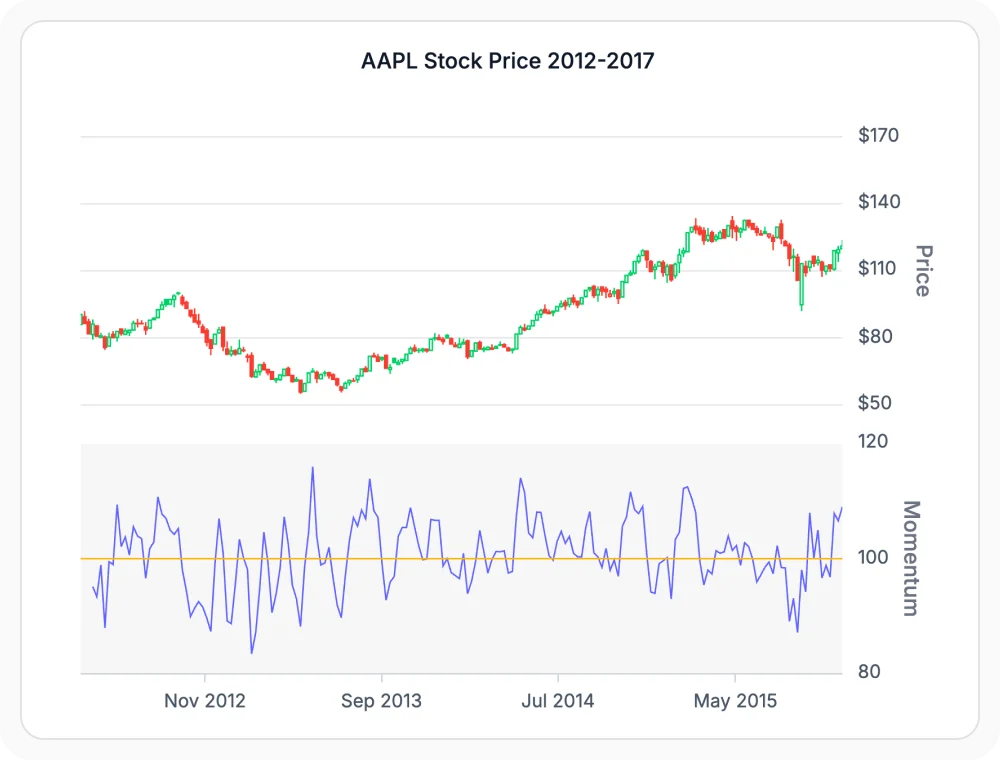
Momentum Indicators
Momentum indicators measure the rate of price change over a selected period. Use them when trend sustainability must be evaluated, since the rate of change surfaces pressure and breakout validation.
- Measure the rate of price change over a selected period.
- Evaluate the strength and direction of market movements.
- Validate breakouts and detect accelerating movements.
- Combine with other indicators to confirm trend sustainability.
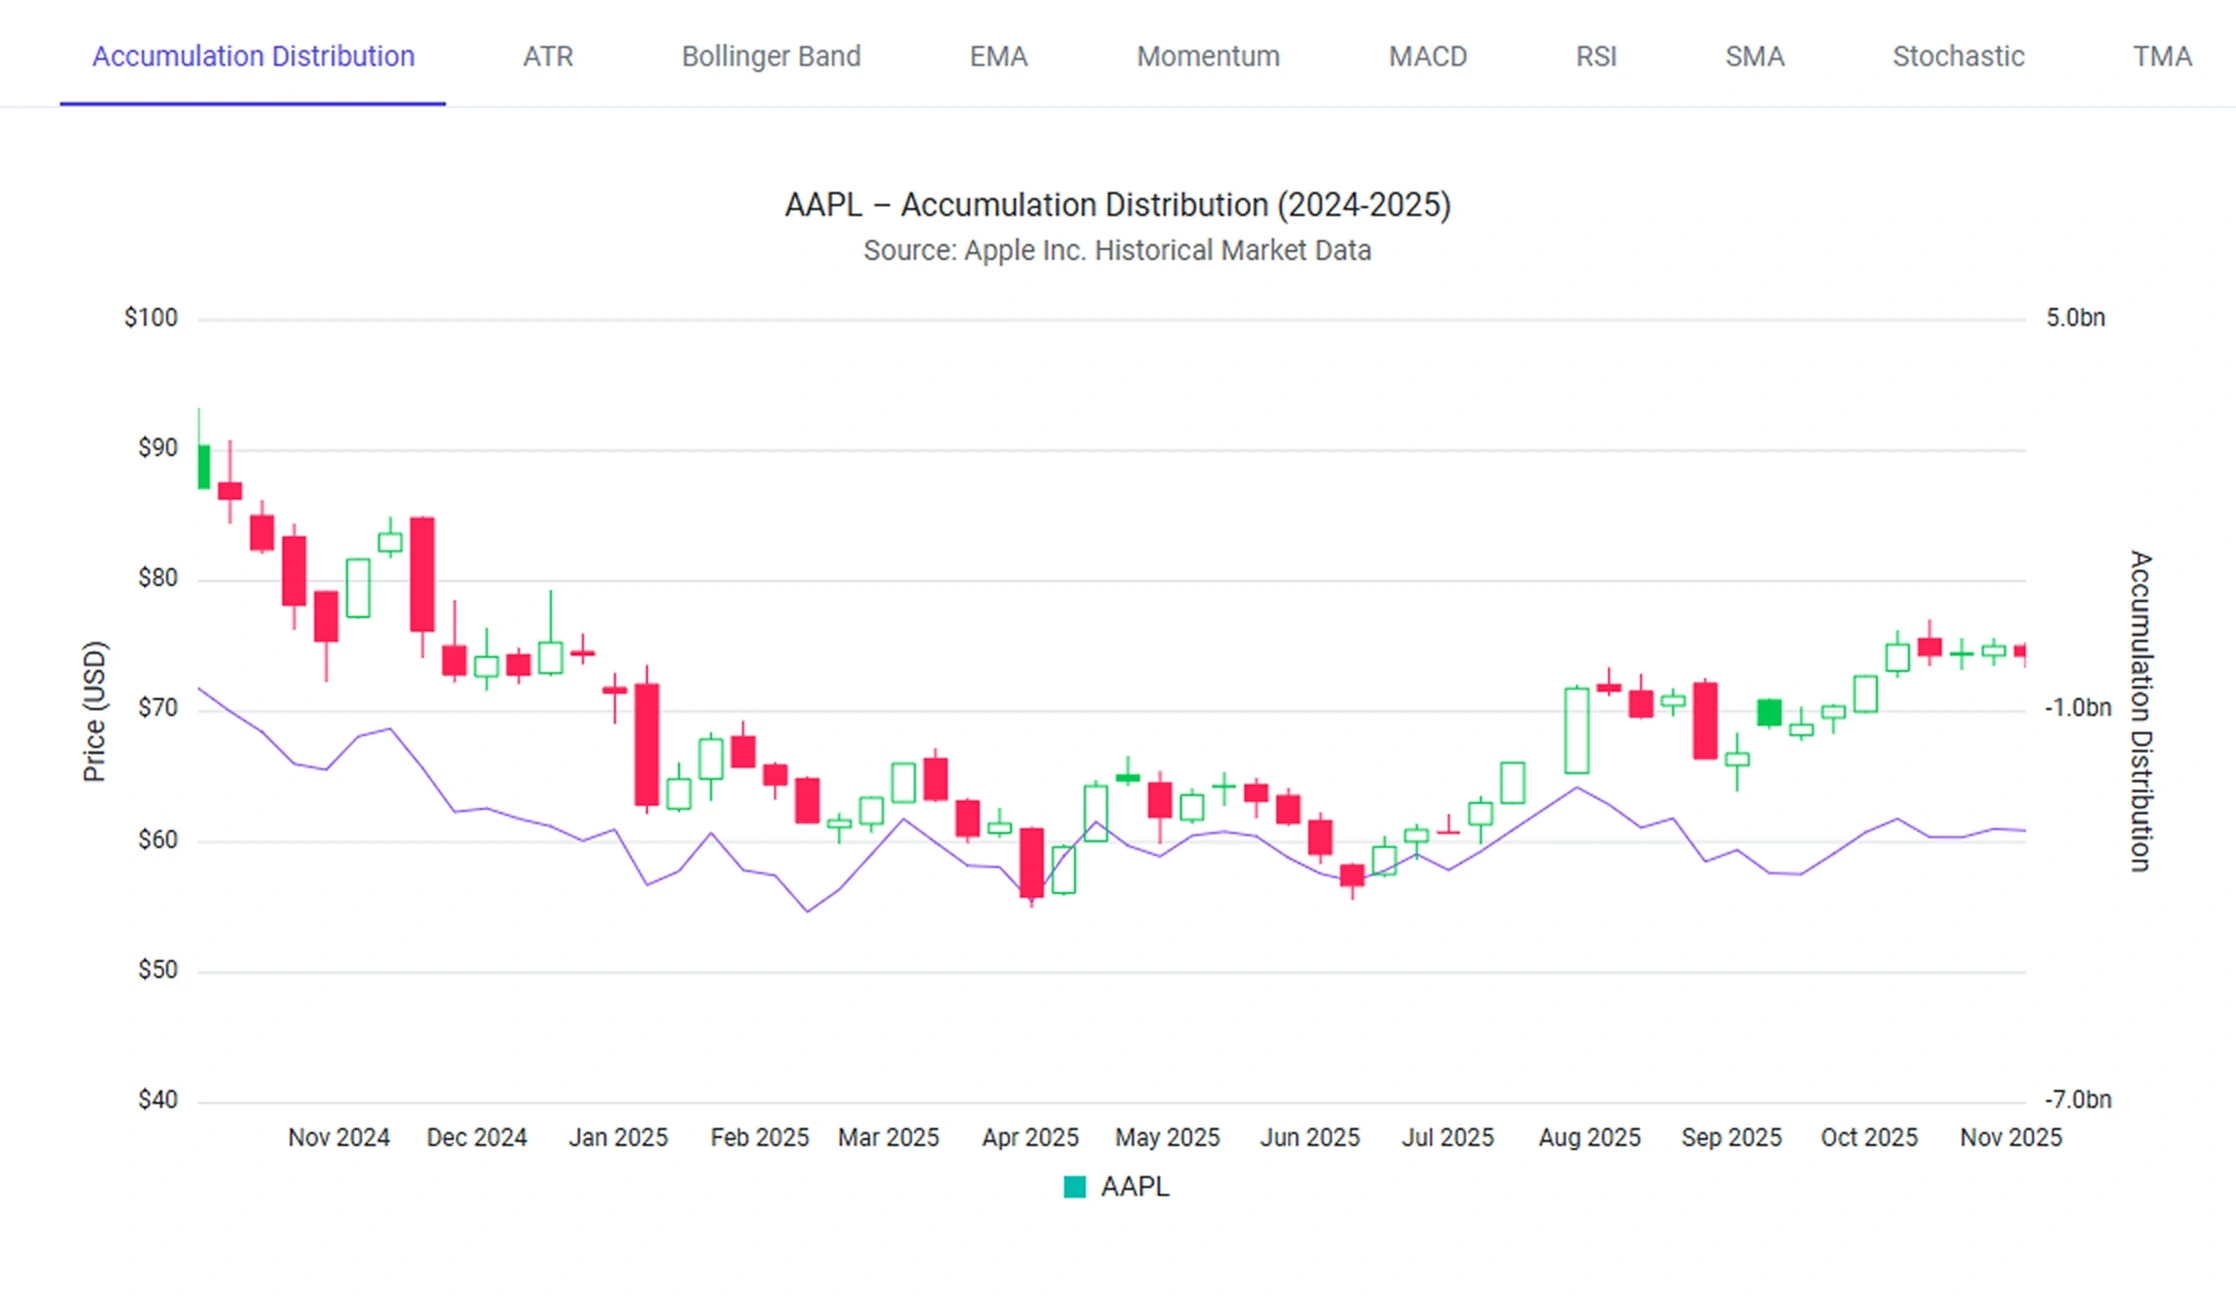
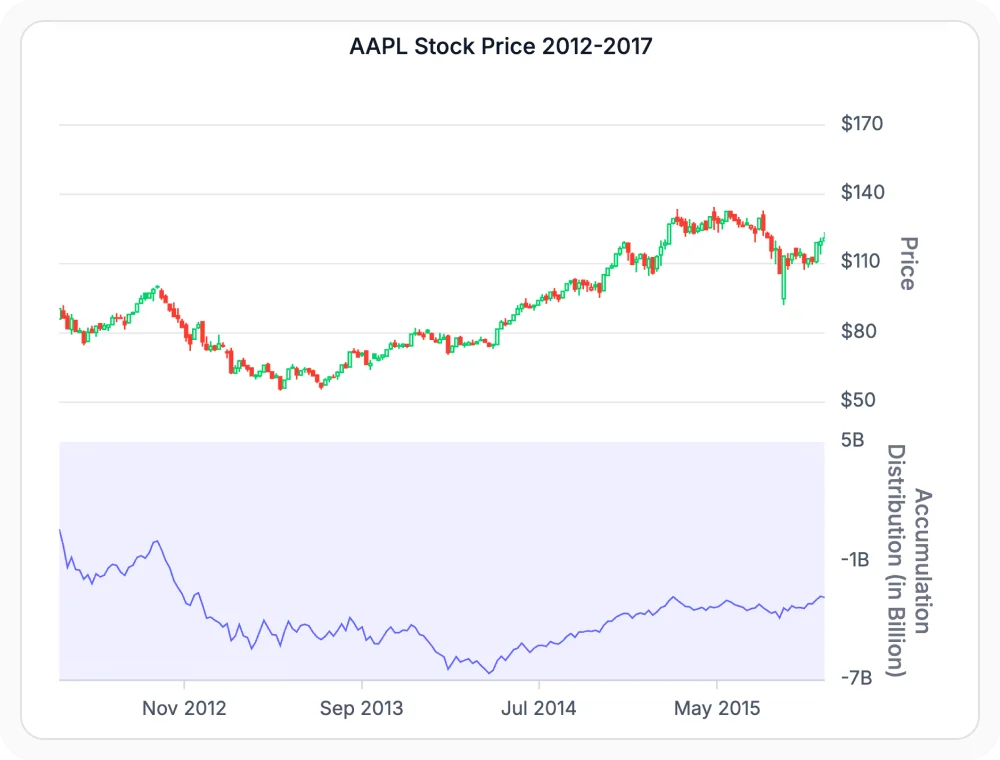
Accumulation Distribution
AD combines price and trading volume to measure buying and selling pressure. Use it for volume-based market analysis, since the relationship between price and volume supports trend validation and divergence detection.
- Combine price and trading volume to measure buying and selling pressure.
- Identify whether money is flowing into or out of a security.
- Validate price trends with volume-based confirmation.
- Detect divergences between price and volume.
Reduce market noise using TMA
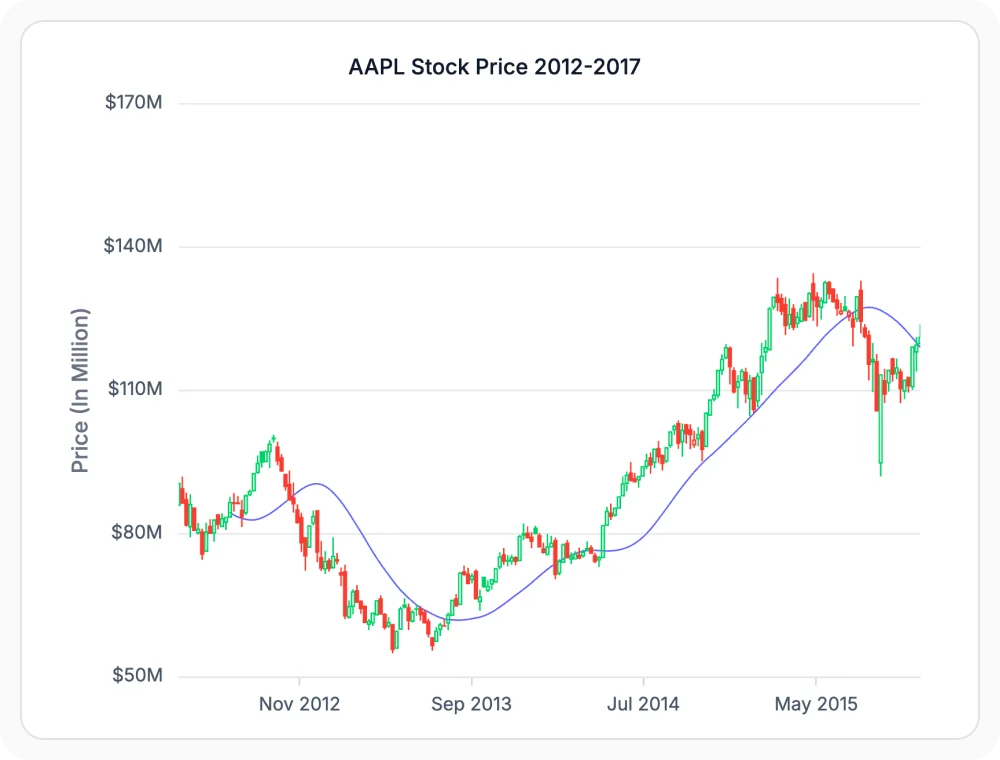
TMA applies a double-smoothing process to create a smoother trend line. Use it when stability matters more than responsiveness, since the smoothing emphasizes long-term trends and reduces market noise.
- Apply a double-smoothing process for a stable trend line.
- Reduce short-term market noise more than SMA or EMA.
- Emphasize the underlying long-term trend direction.
- Use when stability matters more than responsiveness.
GUIDED TECHNICAL ANALYSIS
Apply indicators in four steps
Developers and analysts can connect OHLC data, choose indicators that match their analytical goals, configure visualization settings, and combine multiple indicators to evaluate market behavior.
01
Connect financial data
Provide OHLC and optional volume data from a financial dataset.
02
Choose an indicator type
Select trend, volatility, momentum, or volume-based indicators based on the analysis objective.
03
Analyze market behavior
Adjust periods, colors, line styles, and overlay settings to match the analysis workflow.
04
Combine and analyze
Compare indicator signals, evaluate trends, and investigate momentum, volatility, or volume conditions.
PLATFORM SUPPORT
Apply indicators across platforms
Trend, volatility, and momentum indicators are available across web, desktop, and cross-platform frameworks. Volume-based indicators such as AD require volume data on every supported platform.
| Capability | JS, React, Angular, Vue | Blazor | ASP.NET Core & MVC | WPF & WinForms | .NET MAUI | Flutter |
|---|---|---|---|---|---|---|
| SMA, EMA, TMA trend indicators | ||||||
| Bollinger Bands volatility | ||||||
| ATR volatility measure | ||||||
| RSI, Stochastic oscillators | ||||||
| MACD momentum indicator | ||||||
| Momentum indicator | ||||||
| Accumulation Distribution | ||||||
| showZones overbought/oversold shading |
Frequently Asked Questions
What series type is required for Charts technical indicators?
All technical indicators work with candlestick and OHLC series. Each indicator reads open, high, low, close, and optional volume data from the bound financial dataset.
Which indicators render on secondary axes versus overlay in Charts?
SMA, EMA, TMA, and Bollinger Bands render as overlay indicators on the price series. ATR, RSI, MACD, Stochastic, Momentum, and Accumulation Distribution render on secondary axes.
Can Charts technical indicators combine with other indicators on the same chart?
Yes. Multiple technical indicators can be combined on a single chart to compare trend, momentum, volatility, and volume signals at the same time.
Can Charts display multiple technical indicators on the same chart?
Yes. Multiple indicators can be added to the same chart with independent configuration options. Indicators can be displayed together to provide additional insight into financial data.
Do Charts technical indicators require volume data?
Most technical indicators use OHLC data. Volume data is only required for indicators such as Accumulation Distribution (AD) that incorporate trading volume into their calculations.
What does showZones do in Charts RSI and Stochastic indicators?
The overbought and oversold regions are highlighted through colored zones in RSI and Stochastic indicators. This makes extreme values easier to identify during analysis.
Resources
Learn more about our Charts
Explore demos, KB articles, and documentation to get the most out of our Charts.
Explore guides, APIs, and quick-start tips
See live use cases in action
Ask, share, and connect with peers
Find solutions and best practices fast
Get expert help when you need it
Feature requests and bug reports
Track issues and suggest improvements
Awards
Greatness—it’s one thing to say you have it, but it means more when others recognize it. Syncfusion® is proud to hold the following industry awards.