Skip to content
Blogs
Search blogs
Chart of the week (141)
Chart of the week
Copy RSS feed for this category
4 min read
Jan 9, 2026
Celebrating 75 Blogs of Chart Excellence: A Journey with Syncfusion Charts
Saravanan Madheswaran
11 min read
Nov 6, 2025
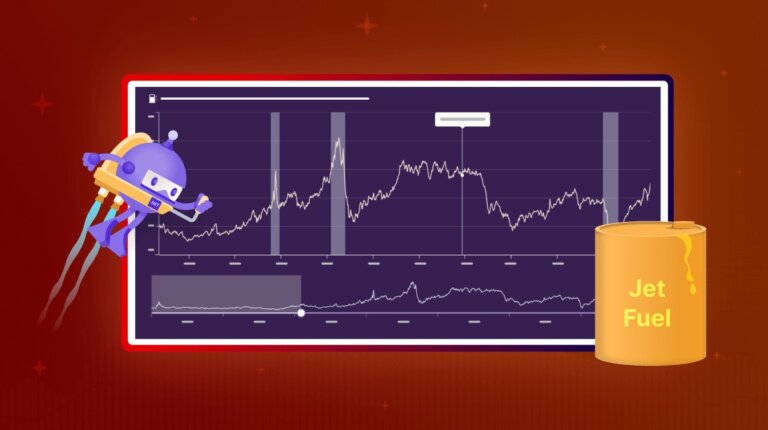
Visualize U.S. Gulf Coast Kerosene-Type Jet Fuel Prices with .NET MAUI Fast Line Chart
Arul Jenith Berkmans
10 min read
Feb 10, 2026
Create a Flutter Semi-Doughnut Chart to Visualize Transport Emissions per Kilometer Traveled
Aswini Suresh Reddy
11 min read
Nov 6, 2025
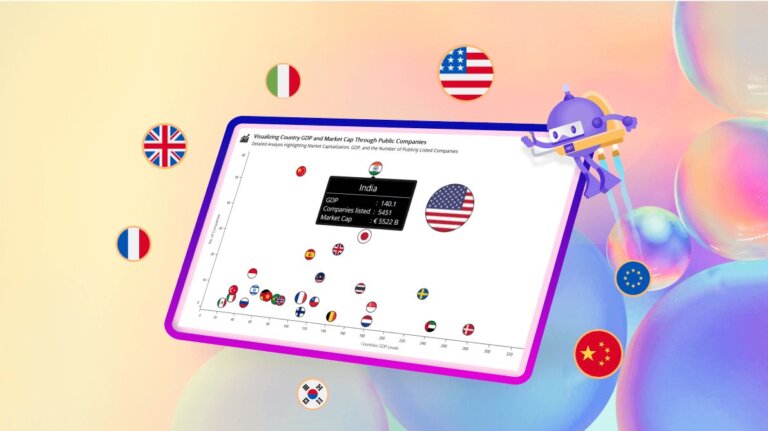
Create a .NET MAUI Bubble Chart to Visualize Market Cap Distribution by Country – GDP and Company Analysis
Harsha Midadhala
9 min read
Jan 19, 2026
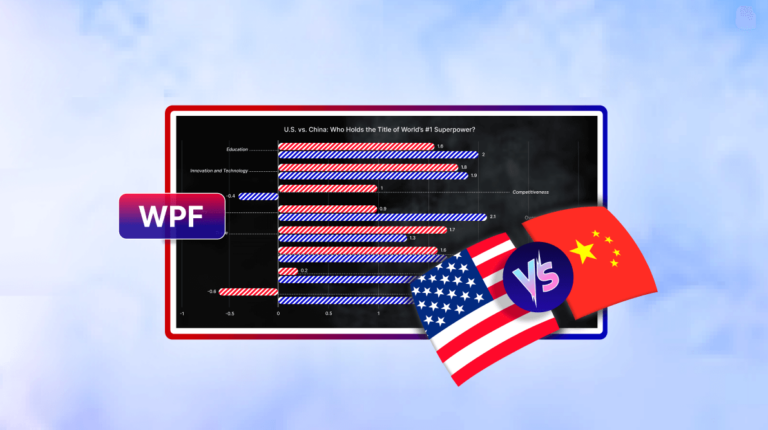
Create a WPF Multi-Bar Chart to Visualize U.S. vs. China Superpower Status
Saiyath Ali Fathima M
9 min read
Jan 9, 2026
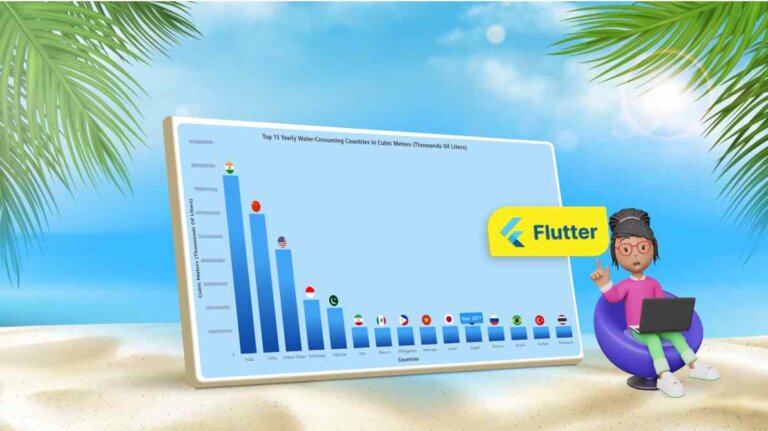
Create a Flutter Column Chart to View the Top 15 Water-Consuming Countries in the World
Preethika Selvam
11 min read
Jan 19, 2026
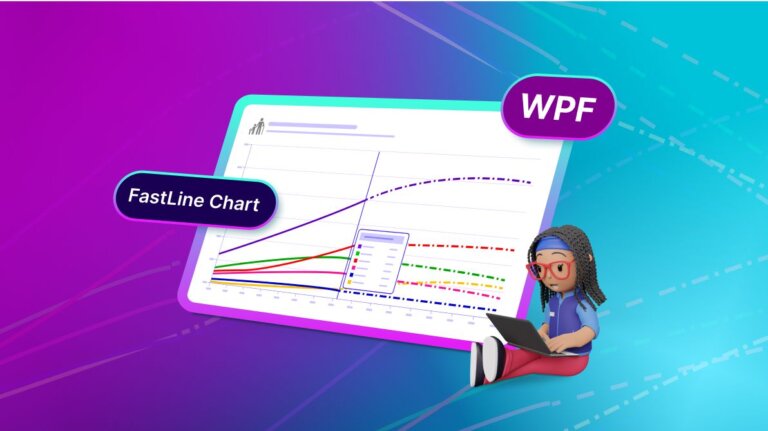
Create a WPF FastLine Chart to Analyze Global Population Trends by Age Group
Vimala Thirumalai Kumar
9 min read
Mar 20, 2025
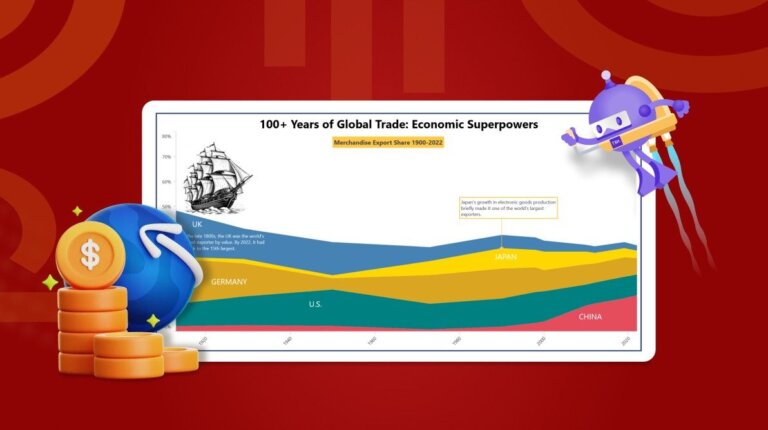
View 100+ Years of Economic Superpowers' Exports with .NET MAUI Stacked Area Chart
Nitheeshkumar Thangaraj
13 min read
Jan 12, 2026
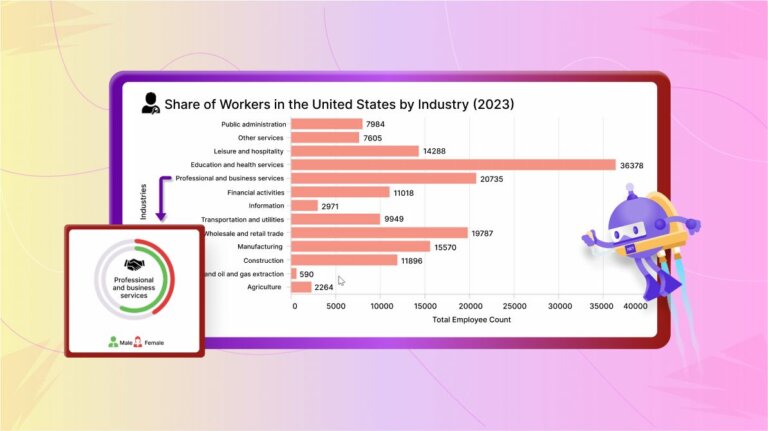
Create a .NET MAUI Drill-Down Chart to View U.S. Workforce Distribution by Industry
Vimala Thirumalai Kumar
1
…
5
6
7
8
9
10
11
…
16
1
…
7
8
9
…
16

 Saravanan Madheswaran
 Arul Jenith Berkmans

 Aswini Suresh Reddy
 Harsha Midadhala
 Saiyath Ali Fathima M
 Preethika Selvam
 Vimala Thirumalai Kumar
 Nitheeshkumar Thangaraj