Skip to content
Blogs
Search blogs
Chart of the week (141)
Chart of the week
Copy RSS feed for this category
16 min read
Oct 13, 2025
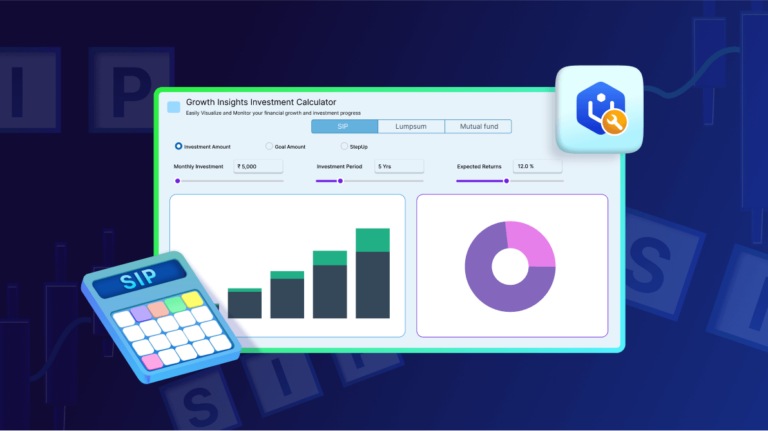
Easily Build an SIP Calculator Using the Syncfusion
®
.NET MAUI Toolkit Charts
Tinesh Kumar Sivakumar
5 min read
May 15, 2025
100 Weeks of Data Visualization Blogs: From AI Charts to Real-Time Dashboards
Vimala Thirumalai Kumar
7 min read
Feb 11, 2026
Bar Chart vs. Pie Chart: The Ultimate Guide to Choosing the Right Chart for Your Data
Nitheeshkumar Thangaraj
9 min read
Jun 9, 2025
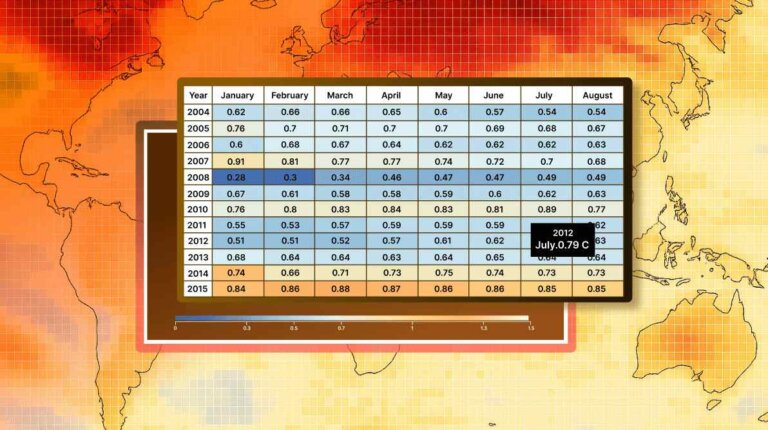
Visualize Global Temperature Anomalies with a Dynamic WPF HeatMap Chart
Sowndharya Selladurai
10 min read
May 5, 2025
Analyze and Track Investment Portfolios with .NET MAUI Toolkit Charts
Harsha Midadhala
19 min read
Apr 22, 2025
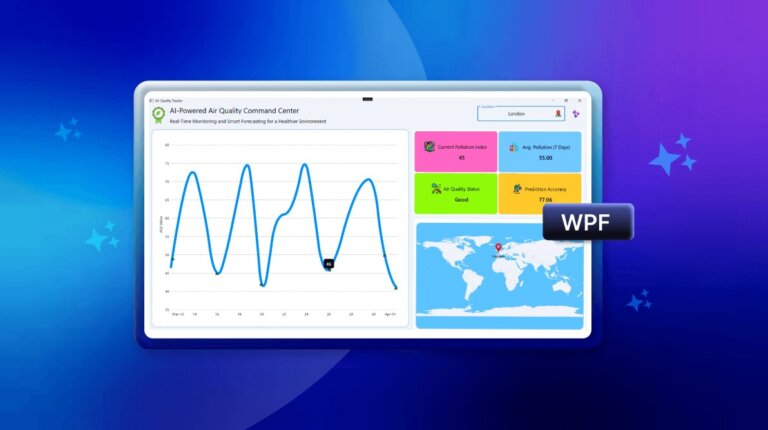
Build an AI-Powered Air Quality Dashboard: Real-Time Analytics & Predictive Insights with WPF Spline Chart
Saiyath Ali Fathima M
14 min read
Jun 24, 2026
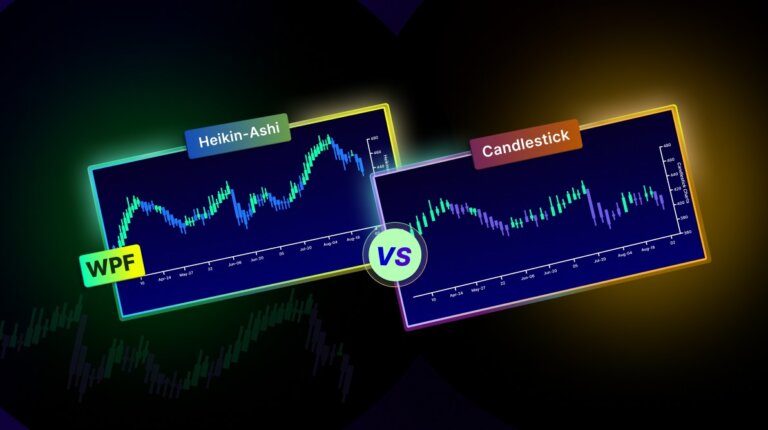
Heikin-Ashi vs. Candlestick Charts: Which Is Better for Market Trend Analysis in WPF?
Dhanaraj Rajendran
13 min read
Apr 3, 2025
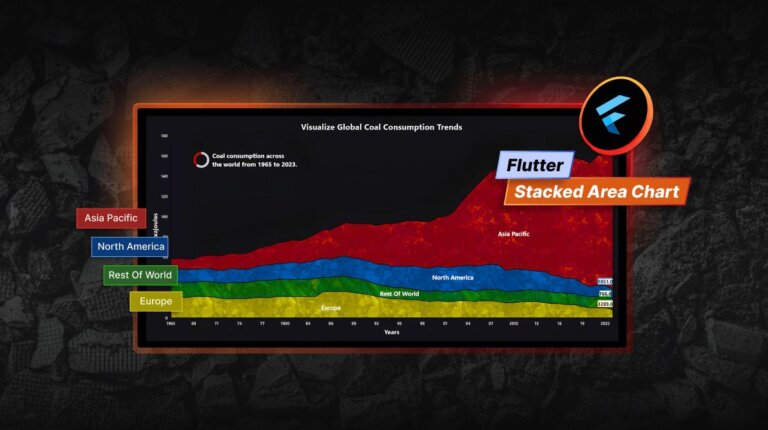
Visualizing Global Coal Consumption Trends with Our Flutter Stacked Area Chart
Aswini Suresh Reddy
14 min read
Mar 27, 2025
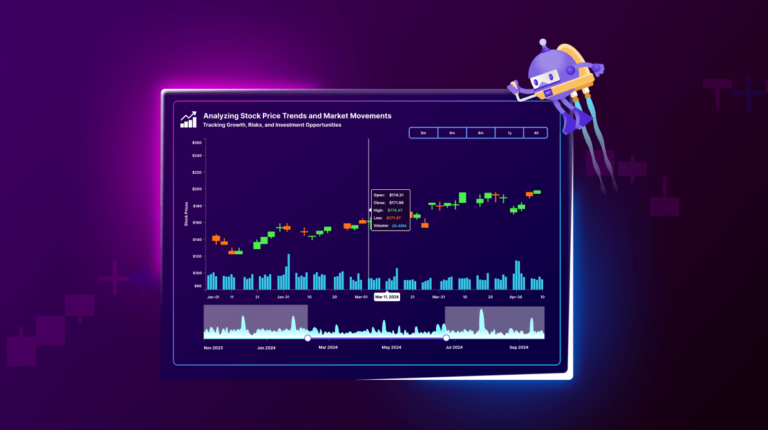
Stock Market Trends Analysis Using .NET MAUI Toolkit Candle Chart
Vallarasu Ravichandran
1
2
3
4
5
6
7
8
…
16
1
…
4
5
6
…
16
 Tinesh Kumar Sivakumar
 Vimala Thirumalai Kumar

 Nitheeshkumar Thangaraj
 Sowndharya Selladurai

 Harsha Midadhala
 Saiyath Ali Fathima M
 Dhanaraj Rajendran
 Aswini Suresh Reddy
 Vallarasu Ravichandran