
 Mohammed Nowfel
TL;DR: Building configurable dashboards usually means creating custom chart builders, field selectors, and persistence logic. Learn how the new Blazor Chart Wizard eliminates that work by letting users configure, save, and export charts directly at runtime.
A dashboard that starts with a simple column chart rarely stays that way.
Business users eventually ask to switch chart types, compare different metrics, save personalized layouts, and export visualizations without waiting for another development cycle.
Supporting these requests often requires developers to build configuration panels, field selectors, chart customization interfaces, persistence mechanisms, and export workflows. In many projects, maintaining the chart configuration experience becomes almost as much work as building the dashboard itself.
The Syncfusion® Blazor Chart Wizard, a new component introduced in Essential Studio® 2026 Volume 2 release, takes a different approach.
Instead of developers defining every chart configuration at design time, Chart Wizard provides a guided runtime experience that allows users to create, customize, save, restore, print, and export charts directly within a Blazor application.
In this article, you’ll build an Olympic medal dashboard using the Chart Wizard component. Along the way, you’ll learn how to:
- Bind business data to Chart Wizard
- Enable runtime chart customization
- Allow users to save and restore chart layouts
- Configure export functionality
- Understand when Chart Wizard is a better choice than a traditional chart component
By the end, you’ll have a practical understanding of how Chart Wizard can reduce development effort while delivering more flexibility to end users.
Why not just use Syncfusion Chart?
Many Blazor applications already use the SfChart component to render charts. So why introduce another charting component? The answer comes down to who controls the visualization.
With the standard chart component, developers define:
- Chart type
- Series configuration
- Axis settings
- Data mappings
- Styling options
Users interact with the finished chart, but typically cannot modify its structure without changes to the application.
When should you use Chart Wizard?
A standard chart component works well when developers control every aspect of the visualization.
Our Blazor Chart Wizard shines when users need flexibility after deployment.
| Scenario | Standard Chart | Chart Wizard |
| Fixed chart configuration | Yes | No |
| Users switch chart types | No | Yes |
| Runtime field mapping | No | Yes |
| Dashboard personalization | No | Yes |
| Save and restore chart layouts | No | Yes |
| Lightweight visualization only | Yes | No |
Think of Chart Wizard as a chart-authoring experience rather than a chart control.
What you will build
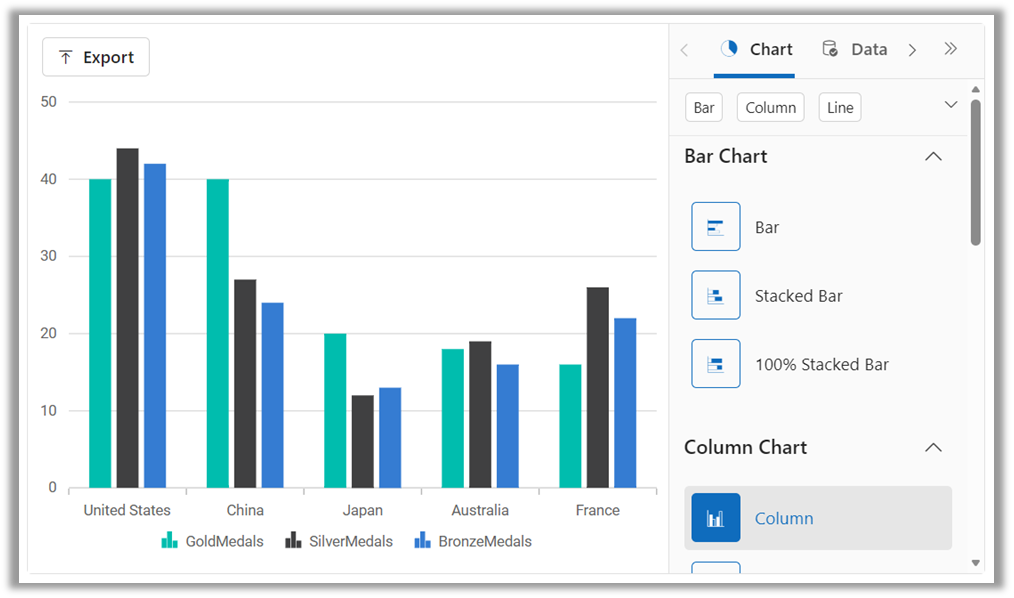
The completed sample includes:
- An
SfChartWizardcomponent. - Medal data from the Paris 2024 Olympic Games.
- Runtime chart configuration.
- Chart layout persistence using serialization.
- Built-in export capabilities.
The result is a dashboard where users can experiment with visualizations without requiring application updates.
How Chart Wizard fits into a dashboard
In a typical analytics solution, your application remains responsible for retrieving, securing, and validating data.
Chart Wizard sits on top of that data and provides a user-friendly configuration layer.
Database / API
↓
Application Services
↓
SfChartWizard
↓
End User
This separation keeps business logic inside your application while giving users freedom to explore data visually.
New to Chart Wizard? The official Getting Started guide walks you through the complete setup process.
Building an Olympic medal dashboard with Chart Wizard
Let’s build an interactive Olympic medal dashboard that supports chart customization, layout persistence, and export.
Define the data model
Chart Wizard works with standard .NET objects, making it easy to integrate with existing business data. We’ll use a simple model representing Olympic medal standings.
public class OlympicMedalData
{
    public string Country { get; set; } = string.Empty;
    public int GoldMedals { get; set; }
    public int SilverMedals { get; set; }
    public int BronzeMedals { get; set; }
}
Prepare sample Olympic medal data
In this example, we’ll use medal data from the Paris 2024 Olympics.
private readonly List<OlympicMedalData> MedalRecords = new()
{
    new()
    {
        Country = "United States",
        GoldMedals = 40,
        SilverMedals = 44,
        BronzeMedals = 42
    },
    …
    new()
    {
        Country = "France",
        GoldMedals = 16,
        SilverMedals = 26,
        BronzeMedals = 22
    }
};
Configure category and series fields
Next, choose the category and series fields. The Chart Wizard uses category fields for labels and numeric fields for series, helping it determine the best way to visualize your data.
private readonly List<string> CategoryFields = new()
{
    "Country"
};
private readonly List<string> SeriesFields = new()
{
    "GoldMedals",
    "SilverMedals",
    "BronzeMedals"
};
Add the Chart Wizard component
We’ll add the SfChartWizard component to the Blazor page and bind it to the Olympic medal data.
@using Syncfusion.Blazor.ChartWizard

<SfChartWizard Width="100%" Height="600px">
    <ChartSettings DataSource="@MedalRecords"
                   CategoryFields="@CategoryFields"
                   SeriesFields="@SeriesFields"
                   SeriesType="ChartWizardSeriesType.Column">
    </ChartSettings>
</SfChartWizard>
What happens next?
After deployment, you can:
- Switch chart types.
- Modify series mappings.
- Reconfigure the visualization.
- Explore the data from different perspectives.
Without Chart Wizard, supporting these capabilities typically requires building custom interfaces.
You can use the SeriesType property to set the initial chart type, while the wizard allows configuration changes to supported chart types at runtime.
Enhance the Chart Wizard with advanced features
Save and restore chart configuration
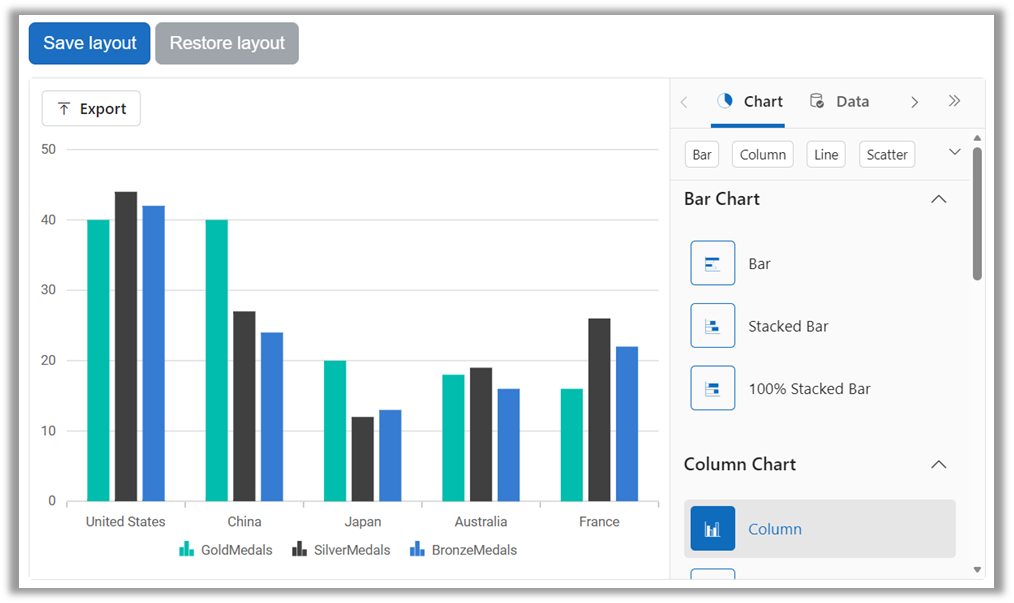
Users often spend time configuring charts exactly the way they want. Serialization allows those configurations to be saved and restored later.
Two methods make this possible:
SaveChart(): Serializes the current chart state and returns it as a JSON string.
LoadChartAsync(string data): Loads a chart configuration from a JSON string produced bySaveChart().
Use the following example to wire save and restore buttons.
<div class="toolbar" style="margin-bottom: 12px;">
    <button class="btn btn-primary" @onclick="SaveChart">Save layout</button>
    <button class="btn btn-secondary"
            @onclick="LoadChartAsync"
            disabled="@string.IsNullOrWhiteSpace(serializedChart)">
        Restore layout
    </button>
</div>
@code
{
    //……
    private Task SaveChart()
    {
        if (ChartWizard is null)
        {
            statusMessage = "Chart Wizard is not ready yet.";
            return Task.CompletedTask;
        }
        serializedChart = ChartWizard.SaveChart();
        statusMessage = "Chart layout saved for this session.";
        return Task.CompletedTask;
    }

    private async Task LoadChartAsync()
    {
        if (ChartWizard is null || string.IsNullOrWhiteSpace(serializedChart))
        {
            statusMessage = "No saved chart layout is available.";
            return;
        }

        await ChartWizard.LoadChartAsync(serializedChart);
        statusMessage = "Saved chart layout restored.";
    }
    //…
}
The serialized output can be stored in:
- Databases
- Browser storage
- Files
- Cloud storage
This makes it possible to provide personalized dashboards that survive between sessions.
Persist saved chart layouts
When storing chart configurations, remember that applications evolve.
- Field names may change.
- Data models may be reorganized.
- Users may load configurations created months earlier.
For that reason, consider storing:
public class SavedChartLayout
{
    public int Id { get; set; }
    public string UserId { get; set; } = string.Empty;
    public string LayoutName { get; set; } = string.Empty;
    public string ChartStateJson { get; set; } = string.Empty;
    public string DataSchemaVersion { get; set; } = "v1";
    public DateTime UpdatedUtc { get; set; }
}
Save operation
var layout = new SavedChartLayout
{
    UserId = userId,
    LayoutName = "My Medal Dashboard",
    ChartStateJson = ChartWizard.SaveChart(),
    UpdatedUtc = DateTime.UtcNow
};

dbContext.ChartLayouts.Add(layout);
await dbContext.SaveChangesAsync();
Load operation
var layout = await dbContext.ChartLayouts
    .FirstOrDefaultAsync(x => x.Id == layoutId);
await ChartWizard.LoadChartAsync(layout.ChartStateJson);
Store a schema version with the layout. If you later rename GoldMedals to Gold, an old, saved layout may reference a field that no longer exists.
Handling invalid saved layouts
Saved layouts can become invalid if fields are renamed, removed, or reorganized after deployment.
Before calling LoadChartAsync(), consider validating:
- Layout ownership
- Schema version compatibility
- Required fields
- JSON format integrity
If validation fails, notify the user and fall back to a default chart configuration rather than attempting to restore the layout.
Configure export
Business users frequently need to share chart results in presentations, reports, and meetings.
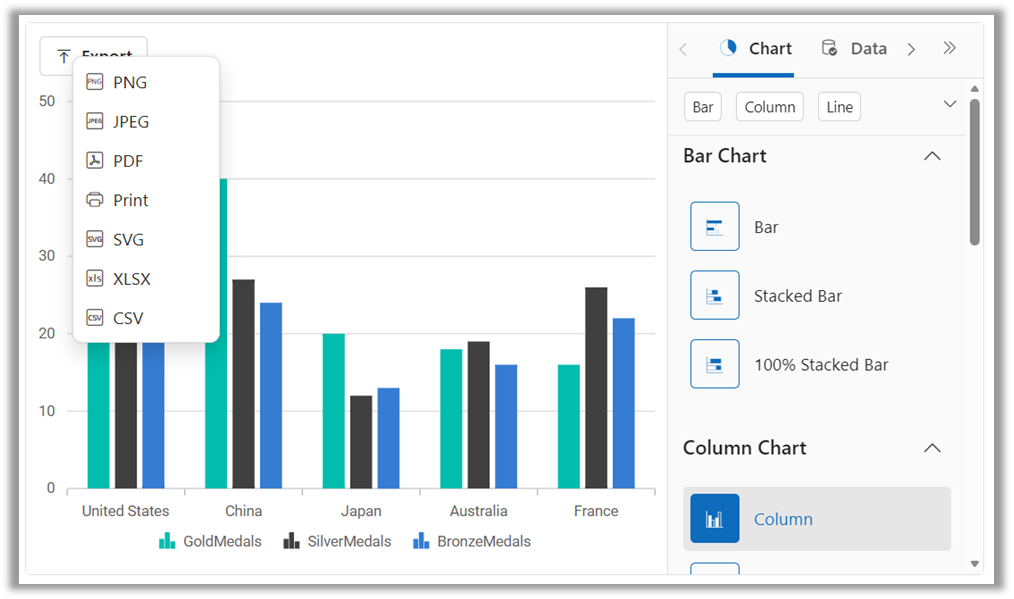
Chart Wizard includes built-in export support for formats such as:
- PNG
- JPEG
- SVG
- CSV
- XLSX
Export settings can be configured directly within the wizard.
<SfChartWizard @ref="ChartWizard"
               Width="100%"
               Height="600px">
    <ChartSettings DataSource="@MedalRecords"
                   CategoryFields="@CategoryFields"
                   SeriesFields="@SeriesFields"
                   SeriesType="ChartWizardSeriesType.Column">
        <ChartExportSettings FileName="OlympicMedalsChart"
                             Width="900"
                             Height="600"
                             Orientation="PageOrientation.Landscape">
        </ChartExportSettings>
    </ChartSettings>
</SfChartWizard>
The export settings can configure the file name, export width, export height, and page orientation.
Optional: Customize export with the Exporting event
You can handle the export event to customize output or cancel export when data is unavailable.
<SfChartWizard Exporting="OnExporting">
    ....
</SfChartWizard>

@code
{
    private void OnExporting(ChartExportingEventArgs args)
    {
        if (MedalRecords.Count == 0)
        {
            args.Cancel = true;
            return;
        }
        args.FileName = $"OlympicMedals-{DateTime.UtcNow:yyyyMMdd}";
        args.Width = 900;
        args.Height = 600;
        args.Orientation = PageOrientation.Landscape;
    }
}
Async data loading pattern
In a real application, your data will usually come from a database, API, or service. Chart Wizard binds to a populated data collection, so fetch the data first and then pass it to ChartSettings.
@if (isLoading)
{
    <p>Loading medal data...</p>
}
else
{
    <SfChartWizard @ref="ChartWizard"
                   Width="100%"
                   Height="600px">
        <ChartSettings DataSource="@MedalRecords"
                       CategoryFields="@CategoryFields"
                       SeriesFields="@SeriesFields"
                       SeriesType="ChartWizardSeriesType.Column">
        </ChartSettings>
    </SfChartWizard>
}
@code
{
    private bool isLoading = true;
    private List<OlympicMedalData> MedalRecords = new();
    protected override async Task OnInitializedAsync()
    {
        MedalRecords = await MedalDataService.GetTopMedalCountriesAsync();
        isLoading = false;
    }
}
Use this pattern when your data source is EF Core, a Web API, or another application service.
Performance tips
When working with large datasets:
- Pre-filter data before binding
- Aggregate records when possible
- Fetch data asynchronously
- Minimize unnecessary fields
- Perform heavy transformations outside the UI layer
The Chart Wizard performs best when focused on visualization rather than large-scale data processing.
Accessibility and localization
Modern dashboards must support a wide range of users.
Chart Wizard includes support for:
- Keyboard navigation
- Screen readers
- High-contrast scenarios
- Right-to-left layouts
- Responsive experiences
RTL support can be enabled with a single property:
<SfChartWizard EnableRtl="true">

</SfChartWizard>
This simplifies deployment for multilingual applications.
Troubleshooting common issues
The wizard does not render
Verify:
- NuGet package installation
- Namespace imports
- Service registration
- Script references
- Interactive rendering configuration
Fields are missing
Check that:
- Property names match exactly.
- Numeric fields are used for chart series.
- Data is available before rendering.
Layout restoration fails
Confirm:
- The string was generated by
SaveChart(). - The layout references valid fields.
- The serialized content is not empty.
Frequently Asked Questions
Yes. After users create a chart, you can customize its appearance using your application’s theme, styling, and Syncfusion configuration options. This allows organizations to maintain consistent branding, colors, fonts, and visual standards across all user-generated charts.Can I apply custom branding and styling to charts created through the Chart Wizard?
You can control the available fields by supplying only the desired entries in the How can I restrict which fields users can visualize in the Chart Wizard?
CategoryFields and SeriesFields collections. This is useful when your underlying data source contains sensitive, calculated, or internal-use fields that should not be exposed to end users.
The layout may fail to restore correctly because the serialized configuration depends on the original field mappings. In production applications, validate saved configurations before loading them and provide fallback behavior when fields have been renamed, removed, or replaced.What happens if a saved chart layout references fields that no longer exist in the data source?

Conclusion
If your charts are completely fixed, a standard chart component is usually the simplest solution.
However, when users need to create their own visualizations, experiment with chart types, save personalized layouts, and export results, the Syncfusion Blazor Chart Wizard offers a much more scalable approach. Introduced in the Essential Studio® 2026 Volume 2 release, Chart Wizard brings a guided chart-authoring experience to Blazor applications, helping developers deliver flexible analytics solutions with less custom UI development.
Instead of spending development time building configuration screens, you can focus on what matters most: data, business rules, security, and user experience.
In this example, you built an Olympic medal dashboard that supports runtime chart creation, layout persistence, and export workflows all without creating a custom chart-builder UI.
Ready to evaluate Chart Wizard in your own Blazor application? Explore the Chart Wizard online demo.
If you’re a Syncfusion user, you can download the setup from the license and downloads page. Otherwise, you can download a free 30-day trial.
You can also contact us via our support forums, support portal, or feedback portal for queries. We are always happy to assist you!







 No spam, just valuable updates.