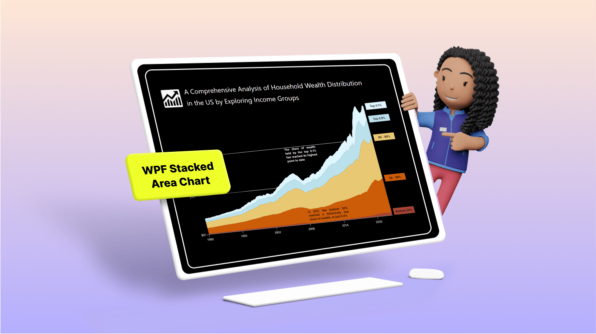
Chart of the Week: Creating a WPF Stacked Area Chart to Visualize Wealth Distribution in the U.S. Arul Jenith Berkmans April 17, 2024
Chart of the Week: Creating a WPF 3D Column Chart to Visualize the Panama Canal’s Shipment Transit Data Surya Karan Raja April 7, 2024
Chart of the Week: Creating a WPF Chart Dashboard to Visualize the 2023 World Billionaires List Sowndharya Selladurai March 19, 2024
Harmonizing Powerhouses: Syncfusion WPF Controls Are Now Compatible with Avalonia XPF Gayathri Ramalingam March 11, 2024
Chart of the Week: Creating a WPF Bar Chart to Visualize the Homelands of America’s International Students Saiyath Ali Fathima M February 21, 2024
Chart of the Week: Creating a WPF Stacked Bar Chart to Visualize the Social Media Use of US Teens in 2023 Karthikeyan V February 7, 2024
Chart of the Week: Creating a WPF 3D Pie Chart to Display the Biggest Cash Crops in the U.S Saiyath Ali Fathima M February 8, 2024
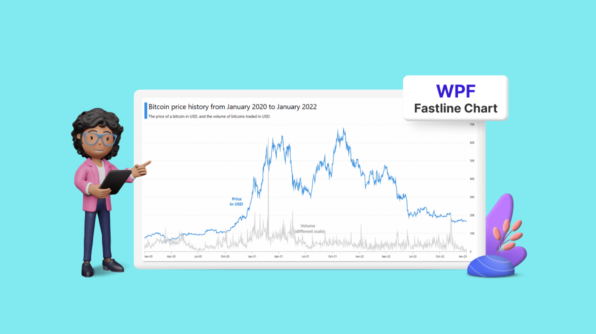
Chart of the Week: Creating a WPF Fast Line Chart for Cryptocurrency Trade Analysis Vimala Thirumalai Kumar November 22, 2023
Chart of the Week: Creating a WPF Column Chart for Countries with the Most Active Volcanoes Saiyath Ali Fathima M February 20, 2024
Streamline Your WPF Development with Syncfusion: Introducing the WPF Template Studio for Visual Studio Jose Seeron Anthony Pitchai October 16, 2023