Standalone UI SDKs
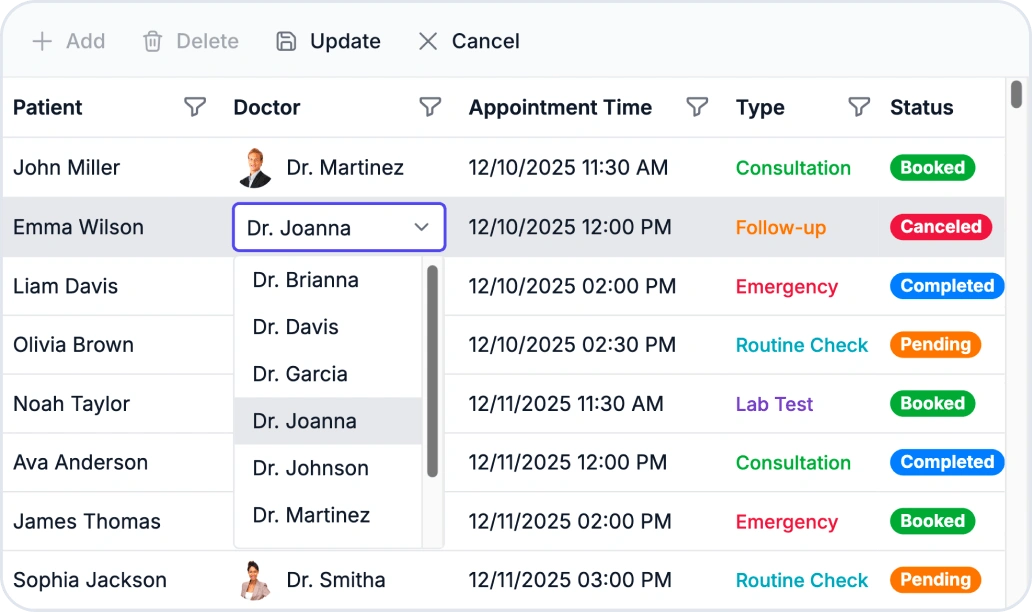
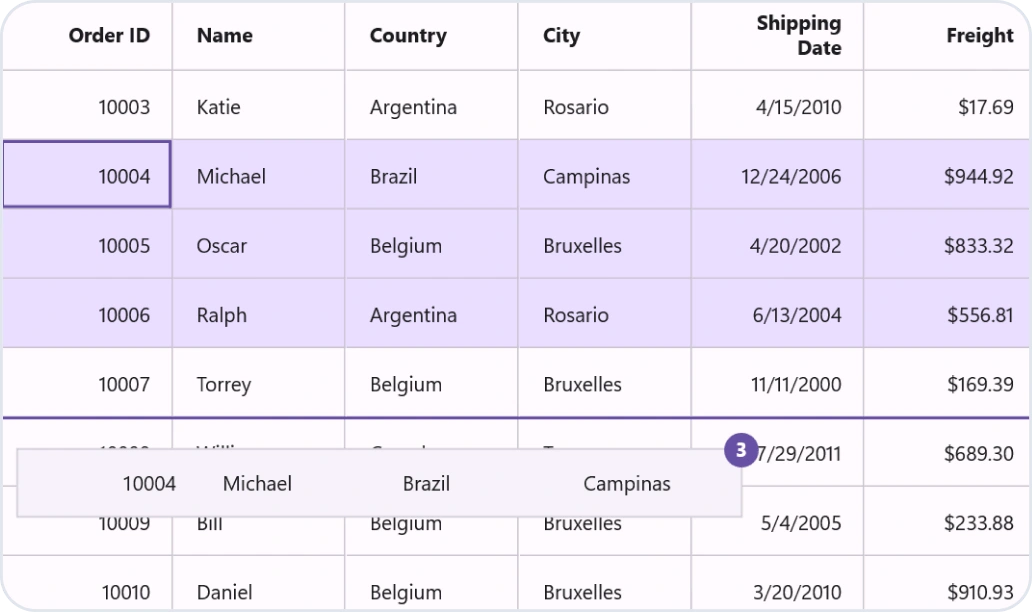
 Grid SDK
Build High-Performance Data Experiences

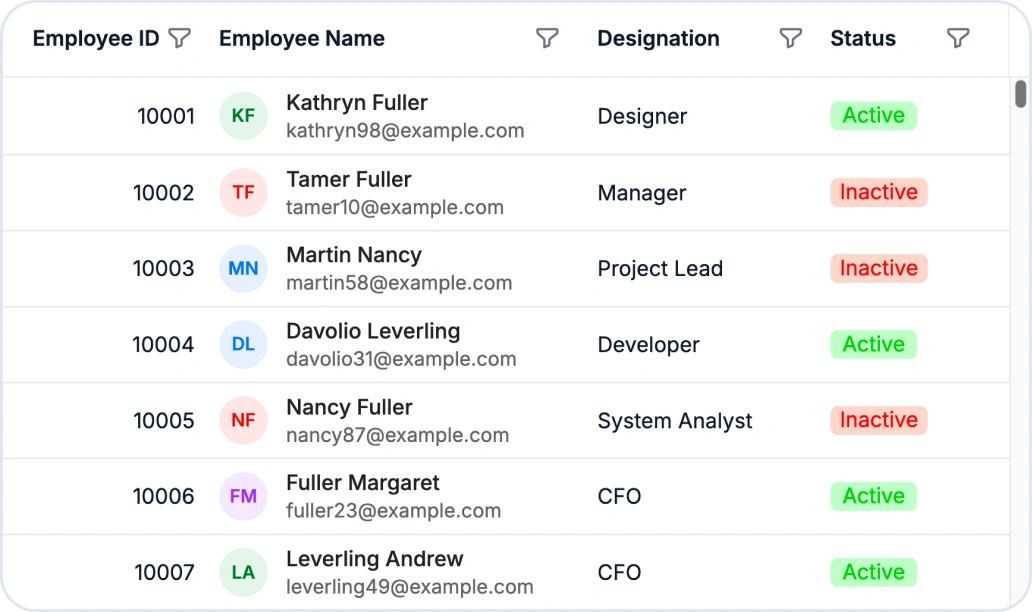
Web DataGrid DOM virtualization boosts scrolling and memory efficiency.
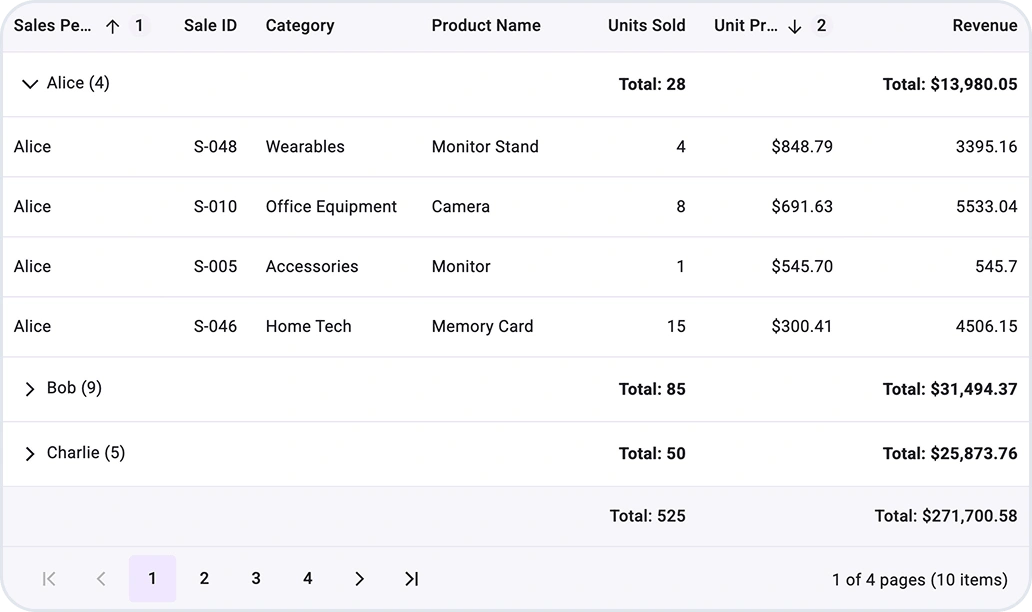
The Pure React DataGrid gains grouping, infinite scrolling, and more.

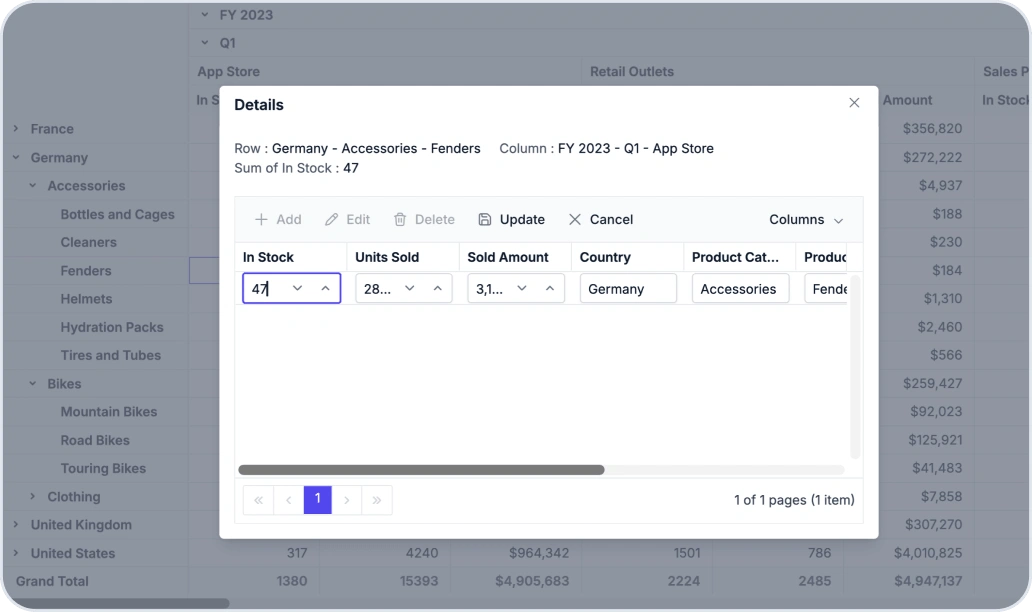
Built-in CRUD operations for the web Pivot Table.
 Chart SDK
Turn Data into Interactive Visualization
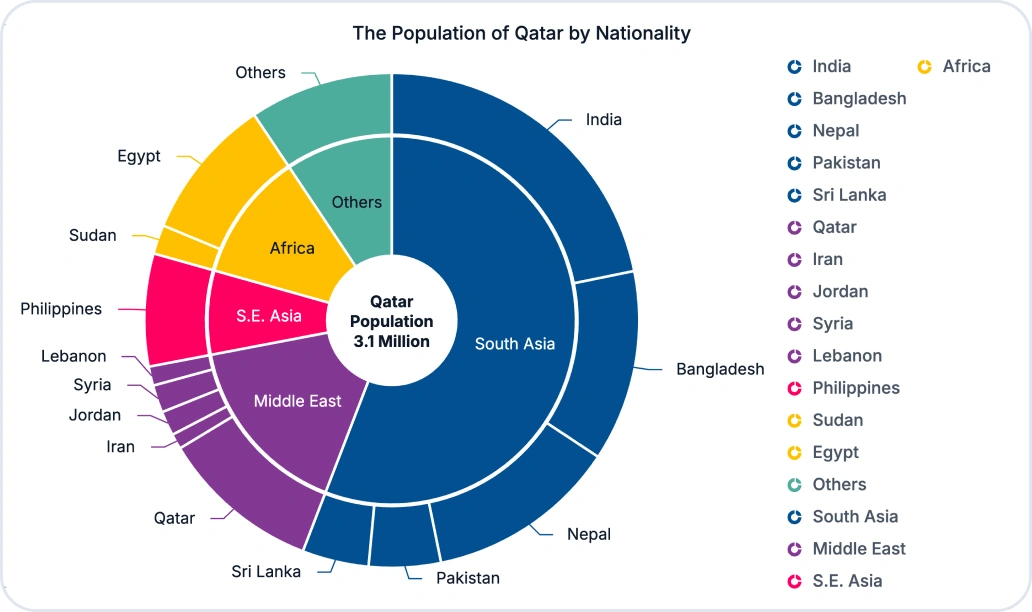
Nested doughnut charts via multi-pie series in web Charts.

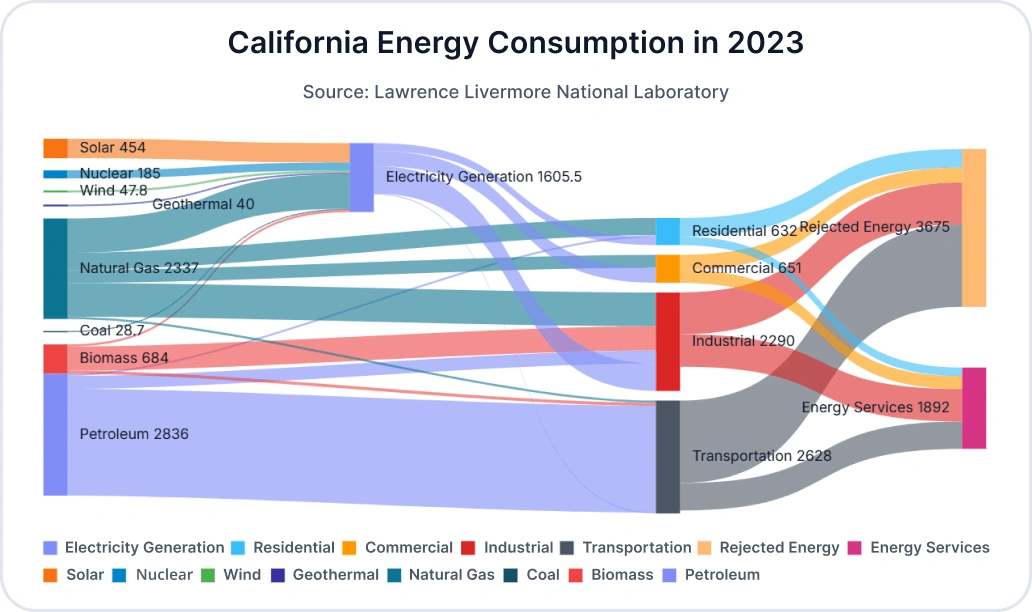
The web Sankey Diagram and Blazor Chart Wizard are now production-ready.
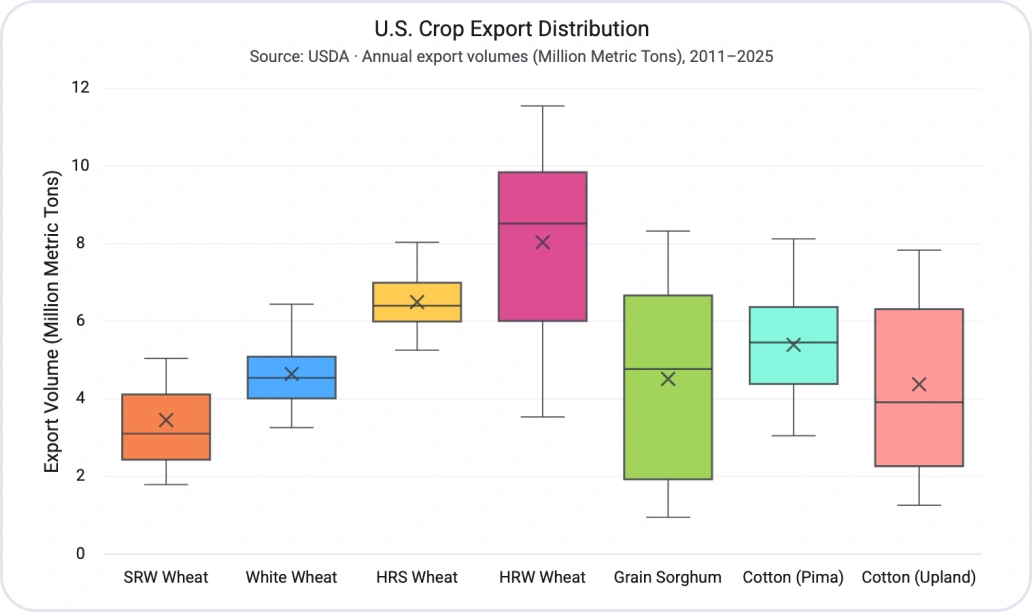
Box and whisker series for the Pure React Charts collection.
 Scheduler SDK
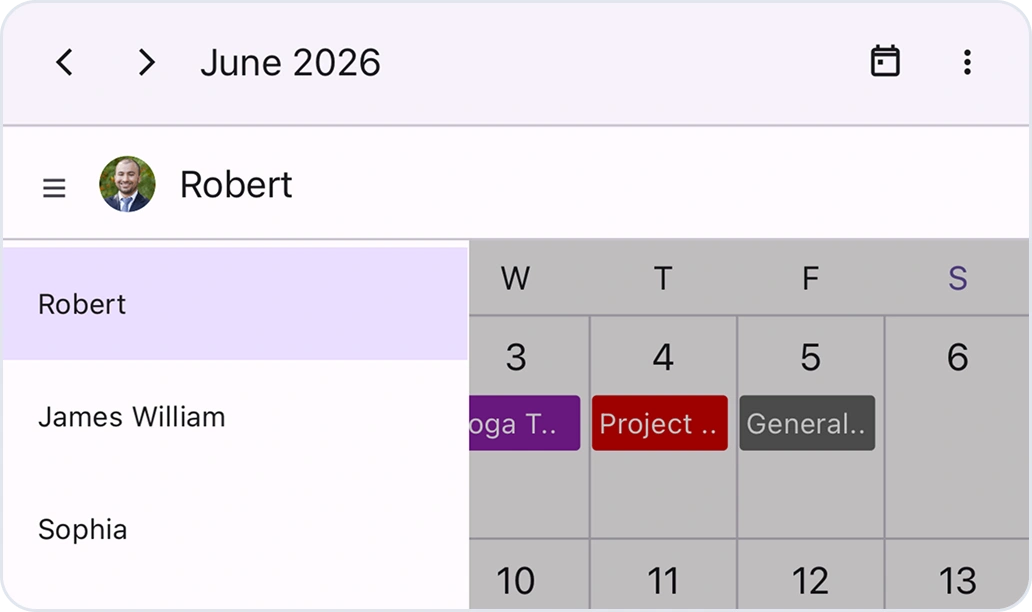
Create Flexible Scheduling Experiences
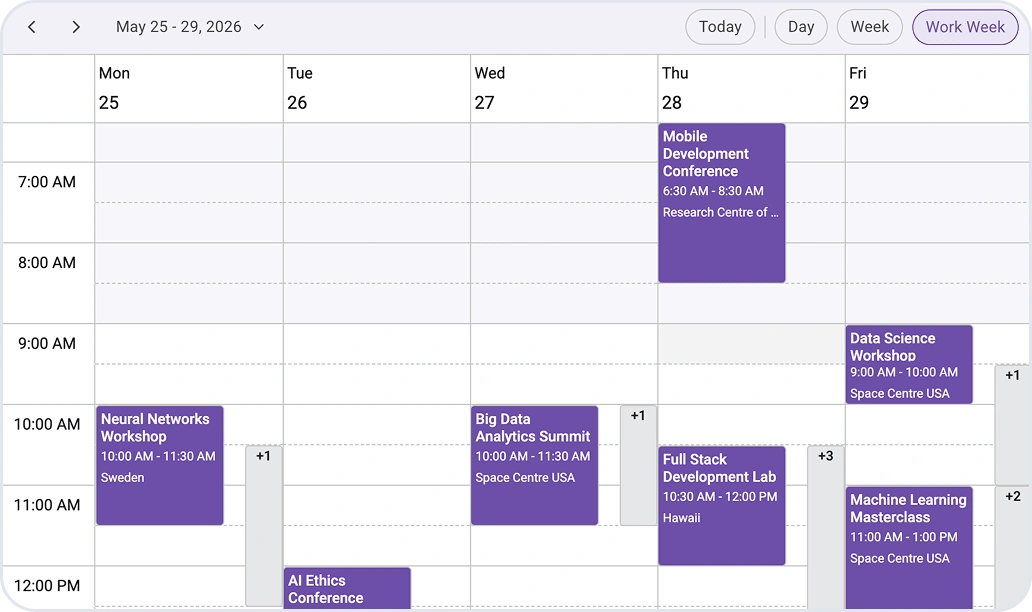
The web Scheduler limits concurrent events for cleaner schedules.

Agenda view, resource grouping, and time zones for the Pure React Scheduler.
Adaptive resource grouping in month view for the .NET MAUI Scheduler.
 Gantt SDK
Plan and Track Projects Visually
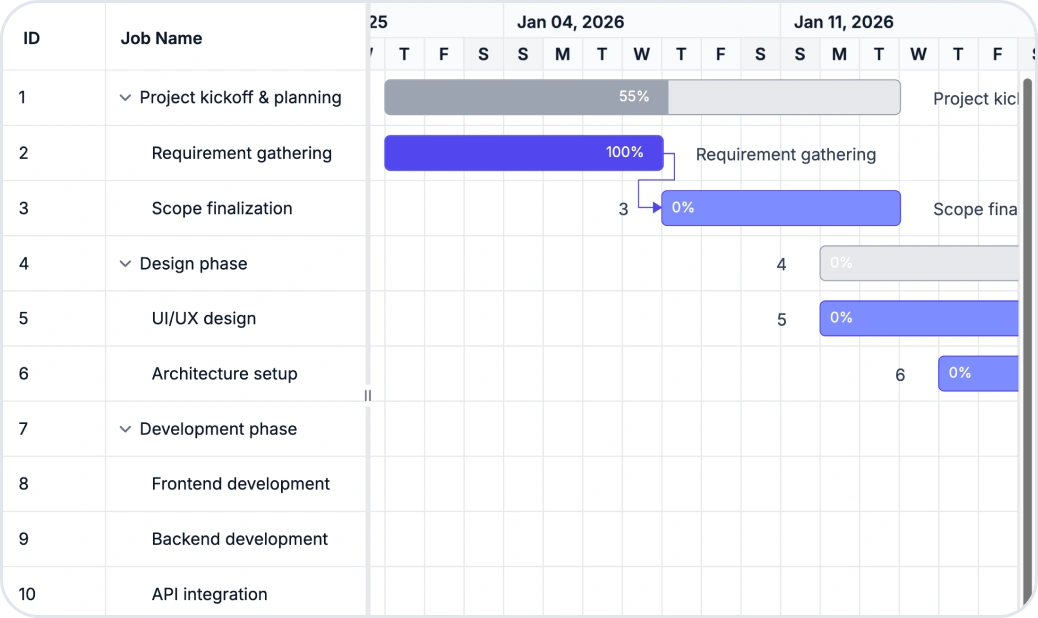
Infinite timeline scrolling in the web Gantt Chart.
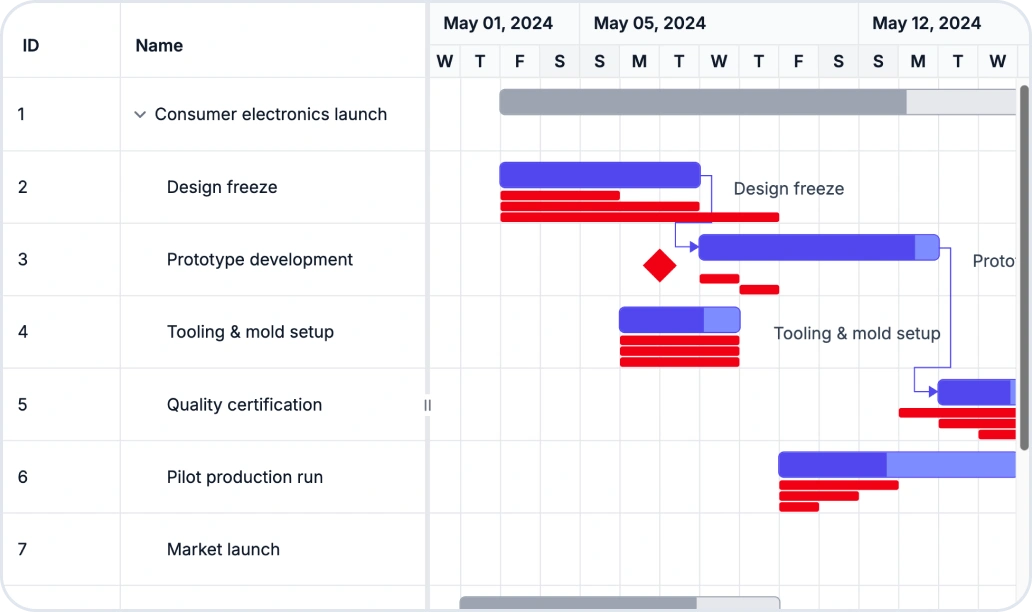
Customizable baseline templates in the web Gantt Chart.
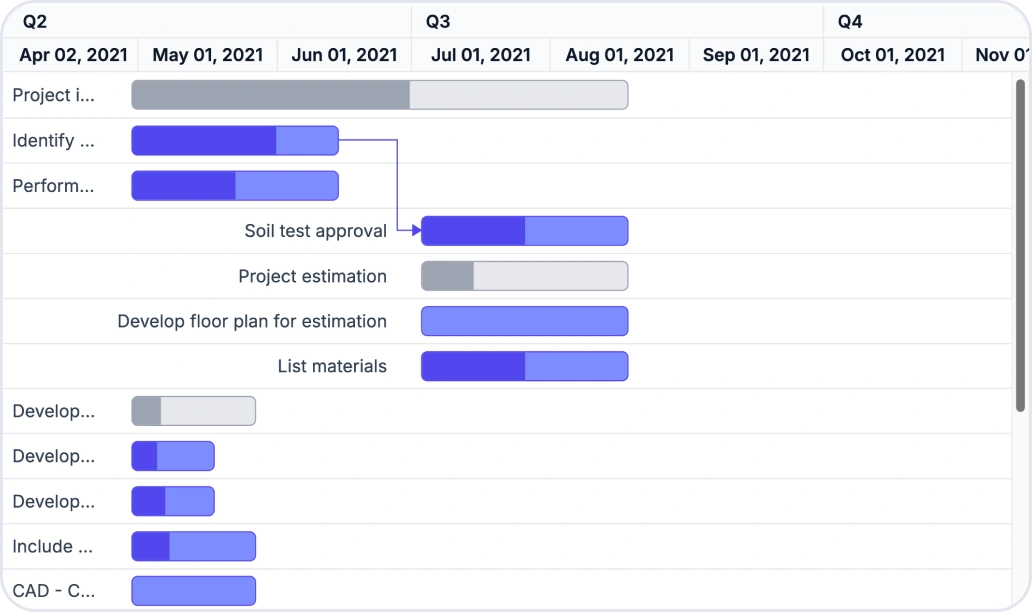
Quarter and half-year timeline view modes in the Blazor Gantt Chart.
 Rich Text Editor SDK
Enable Rich-Content Editing Experiences
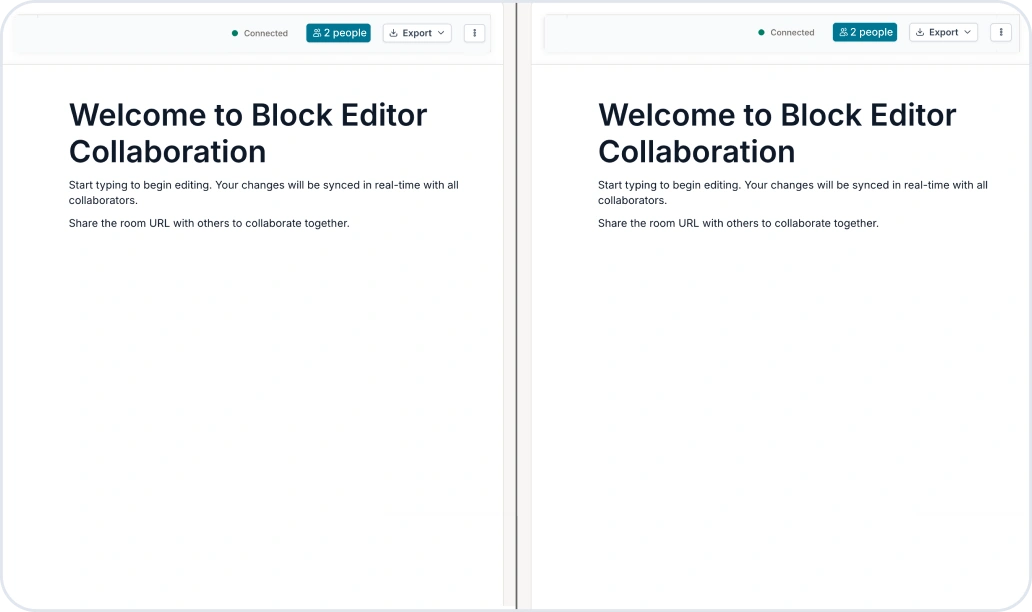
Simultaneous document authoring in the web Block Editor.
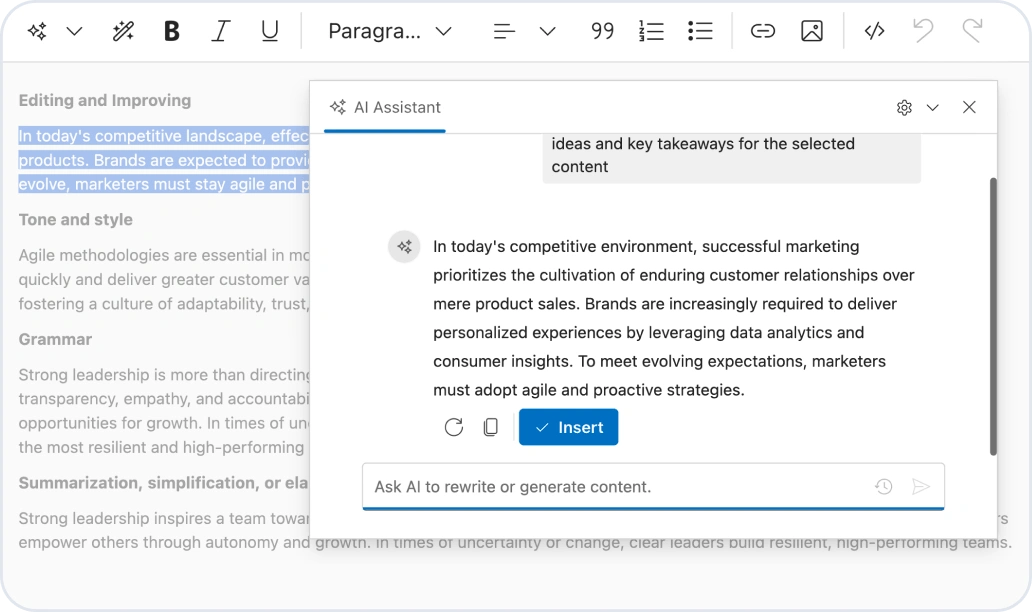
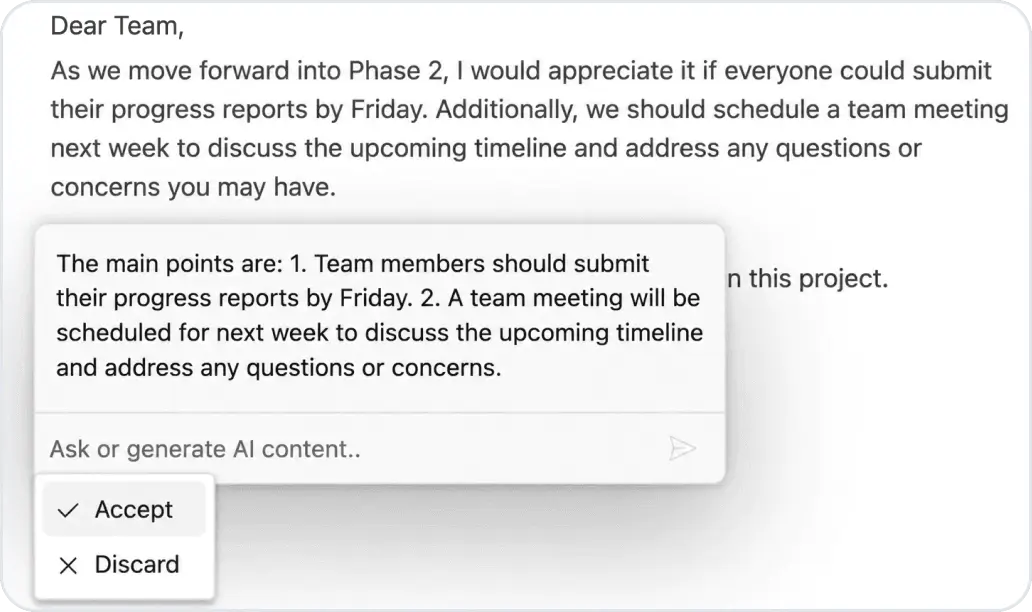
The Blazor Smart Rich Text Editor becomes production-ready with built-in, AI-assisted writing.

Export progress and audio/video paste support in the web Rich Text Editor.
 Diagram SDK
Design Interactive Workflows and Diagrams
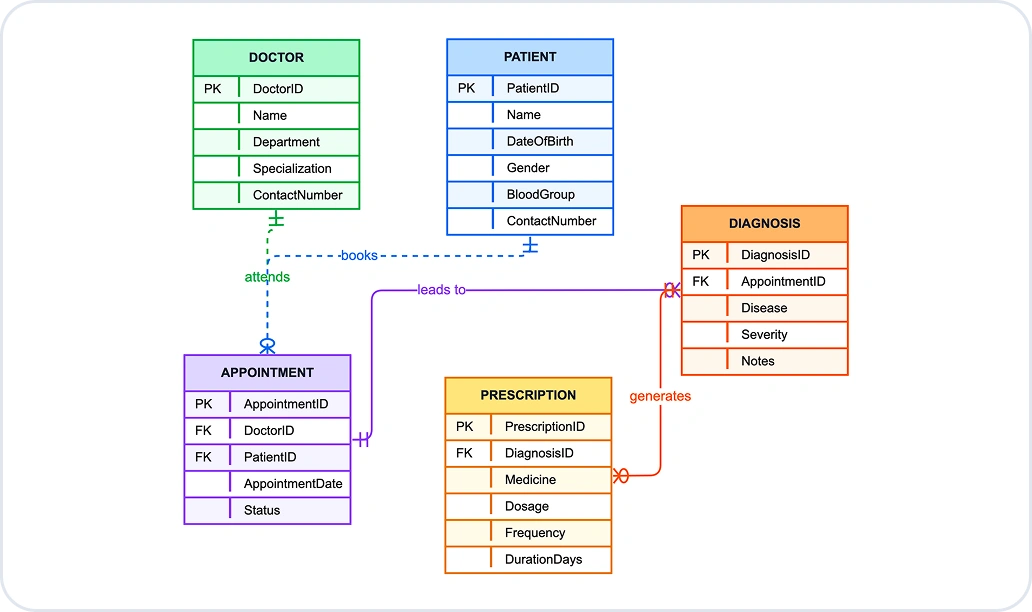
Entity relationship (ER) diagrams for database modeling in the web Diagram.
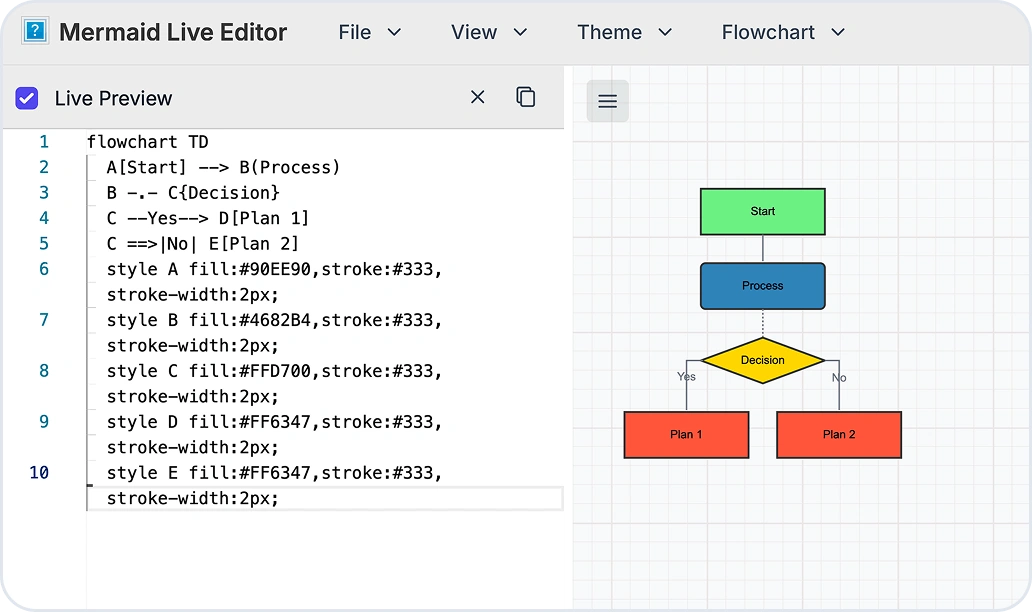
The web Diagram maintains Mermaid diagram fidelity when saving and reloading.
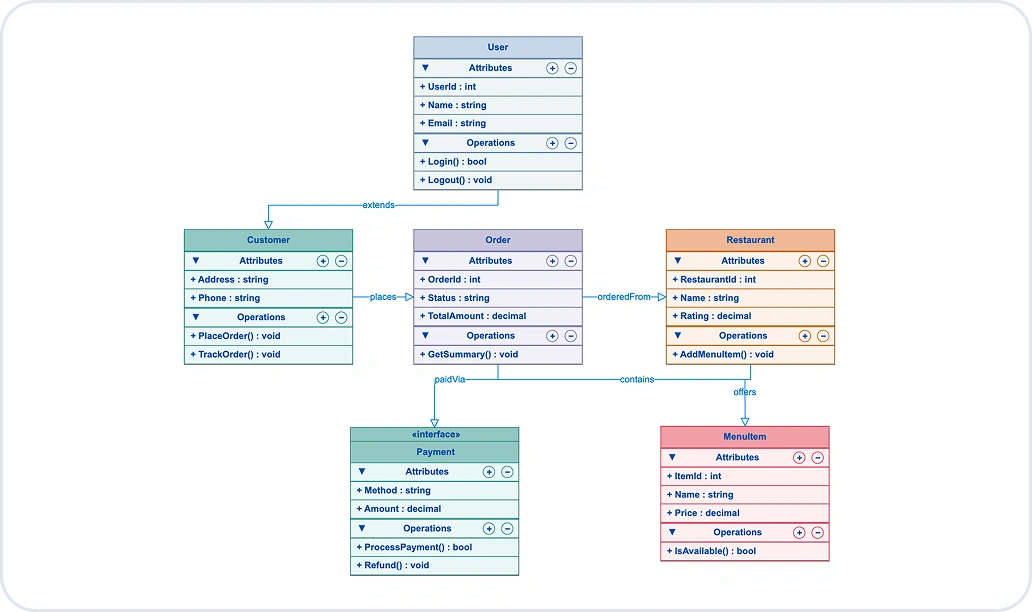
Unified Modeling Language (UML) class diagrams in the Blazor Diagram.
Document Solutions
 Document SDK
All-in-One SDKs for Document Processing
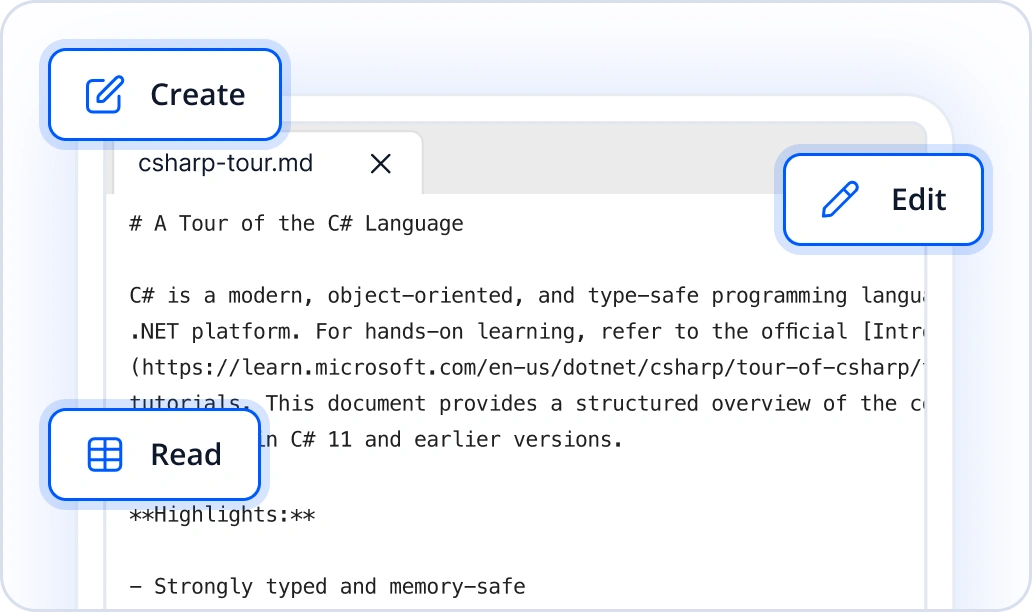
New .NET Markdown Library to create, read, convert, and edit Markdown.
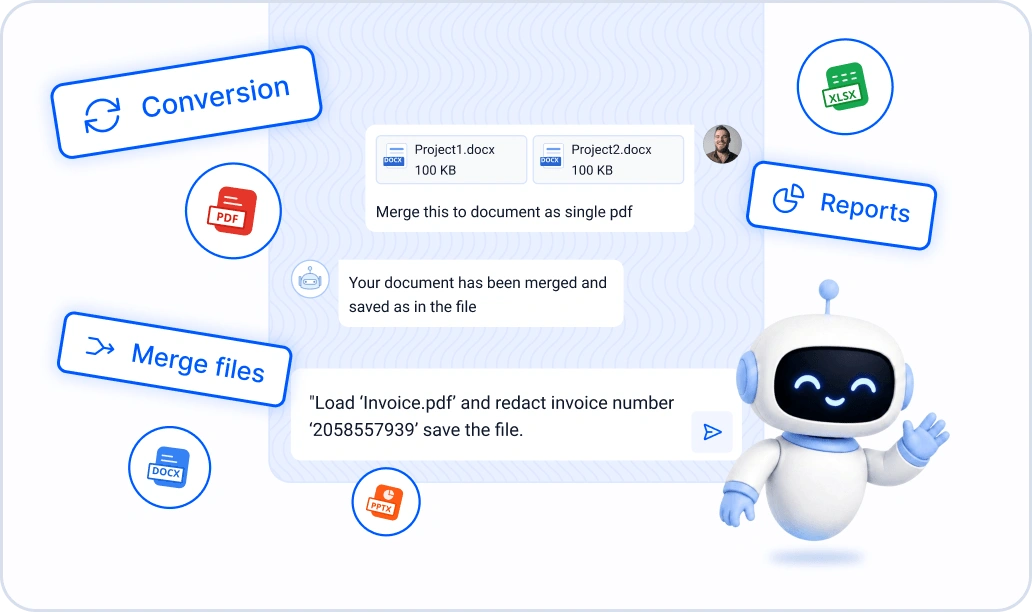
AI Agents can create, manipulate, convert, and extract data from files with AI Agent Tools.
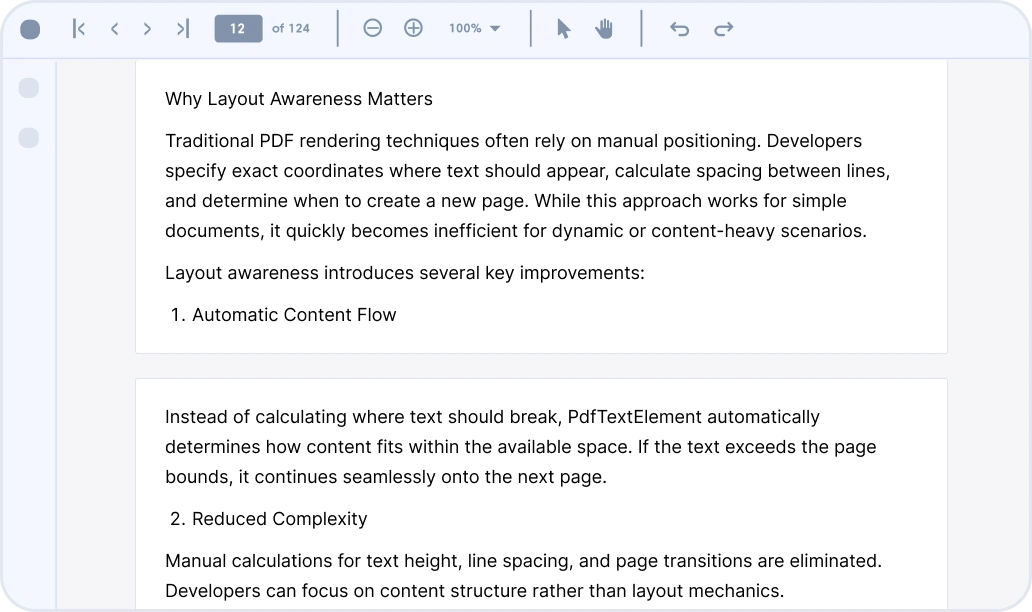
Layout-aware text flow with automatic pagination for the JavaScript PDF Library.
 PDF Viewer SDK
Seamless PDF Viewing & Form Filling
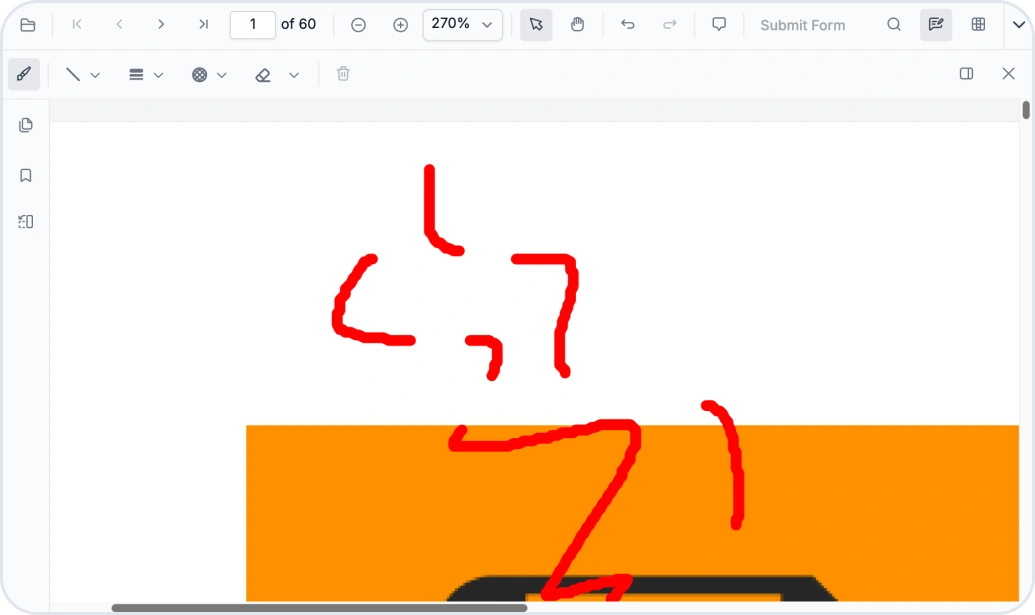
The web PDF Viewer lets users erase ink annotations for precise markup editing.
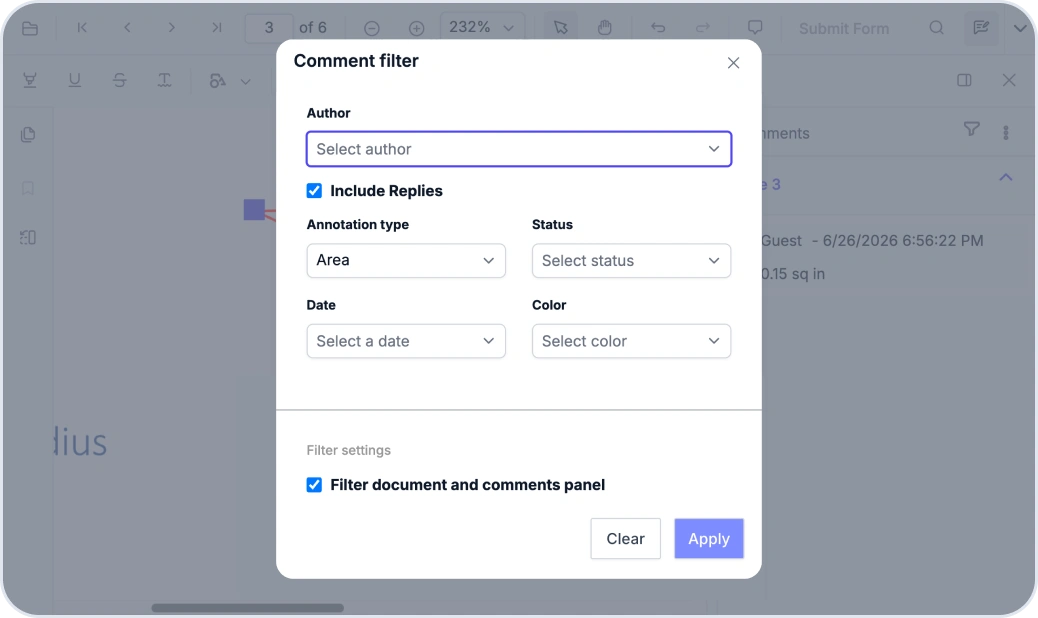
The web PDF Viewer lets users filter annotation comments for faster document reviews.
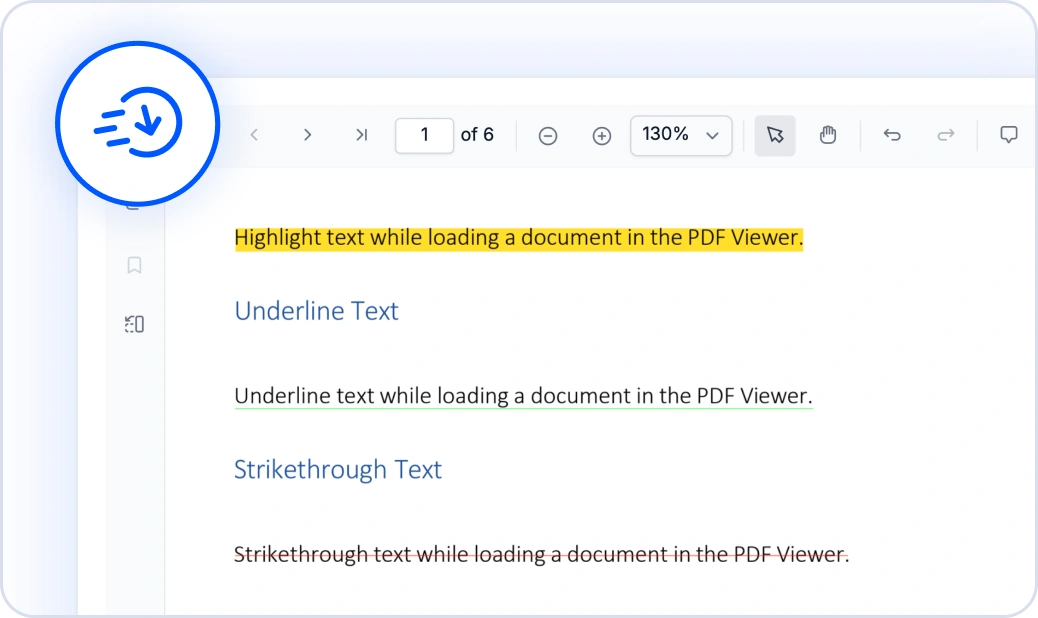
The web PDF Viewer has improved download performance.
 DOCX Editor SDK
Edit DOCX Documents in the Browser

Bidirectional text formatting in the web DOCX Editor.
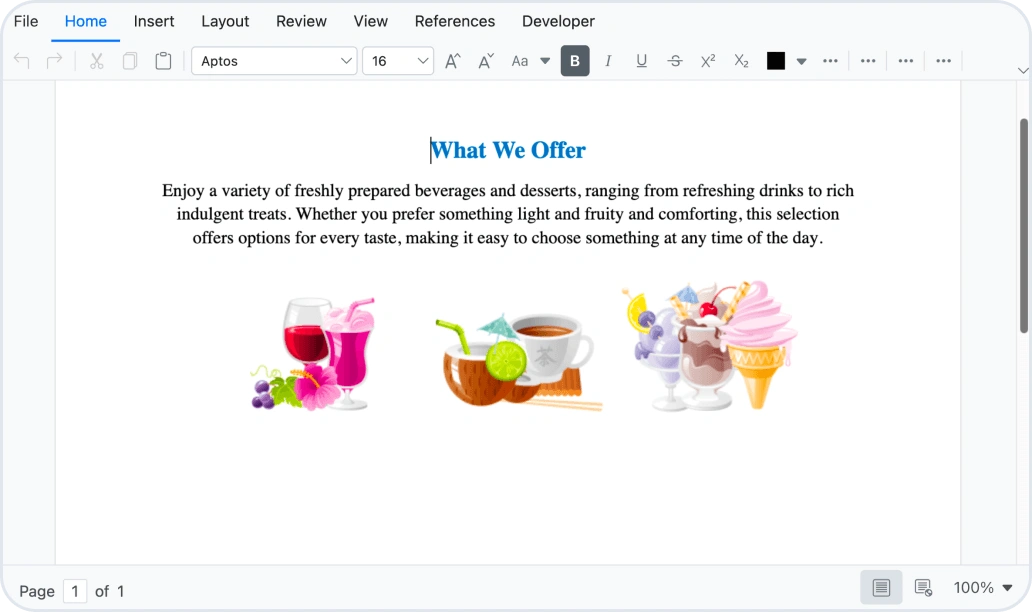
The web DOCX Editor preserves complex image layouts.
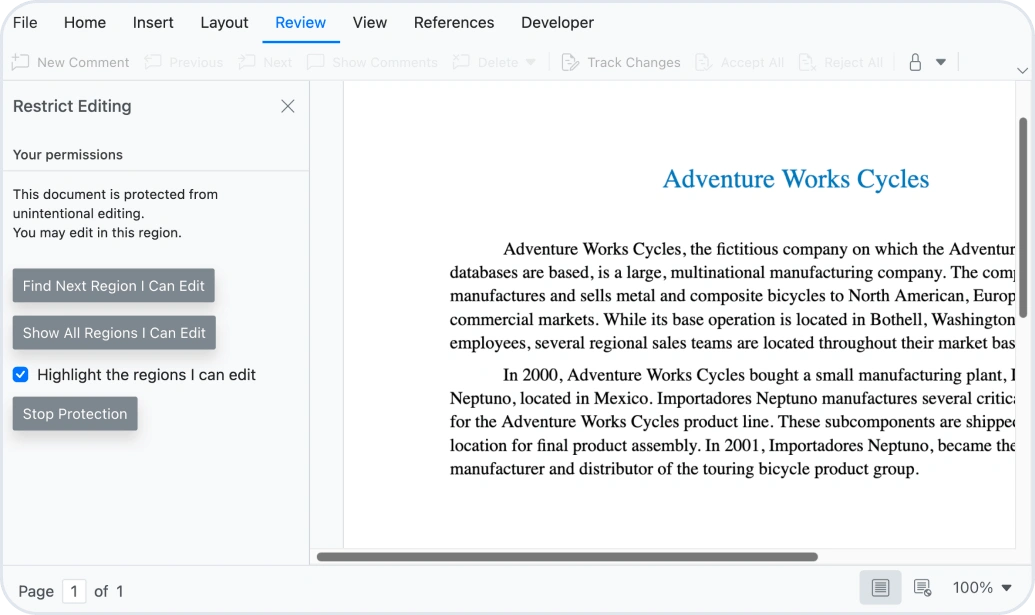
Enhanced hash computation for the web DOCX Editor.
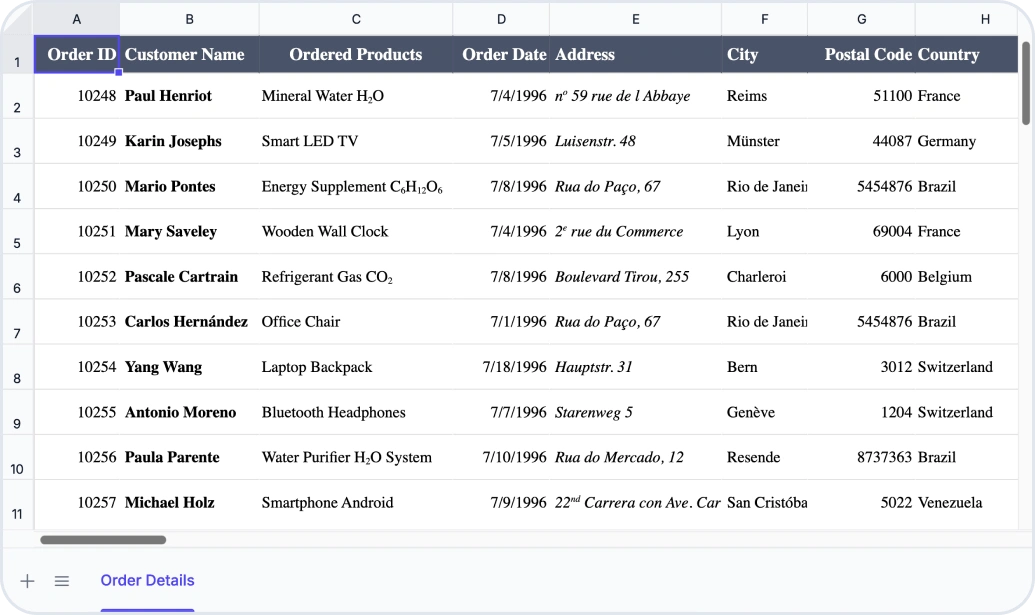
 Spreadsheet Editor SDK
Excel-Like Editing & Data Analysis
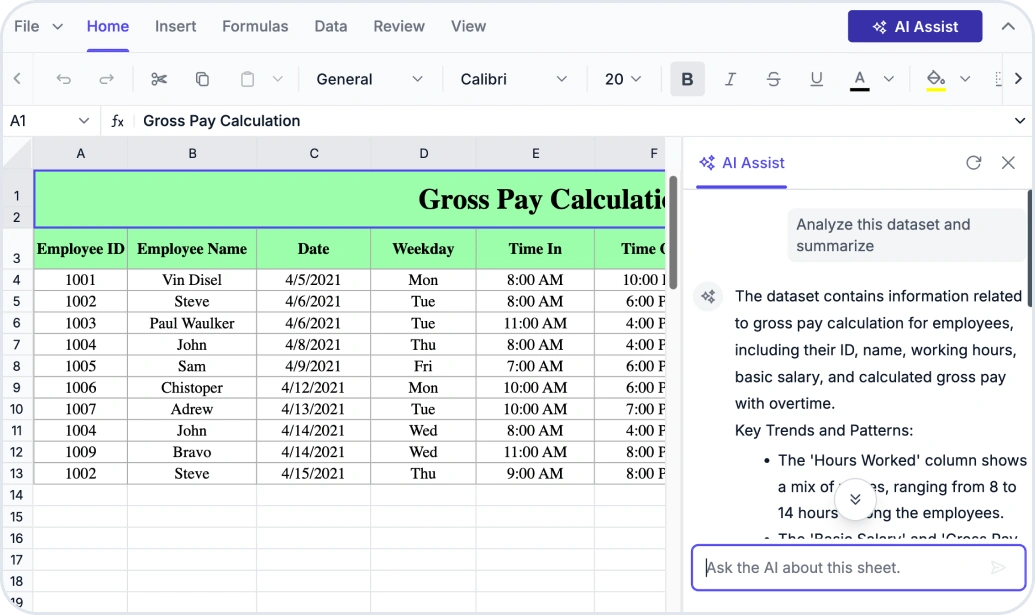
AI assistance for natural-language editing in the web Spreadsheet Editor.
The web Spreadsheet Editor boosts bulk operation performance by up to 7 times.
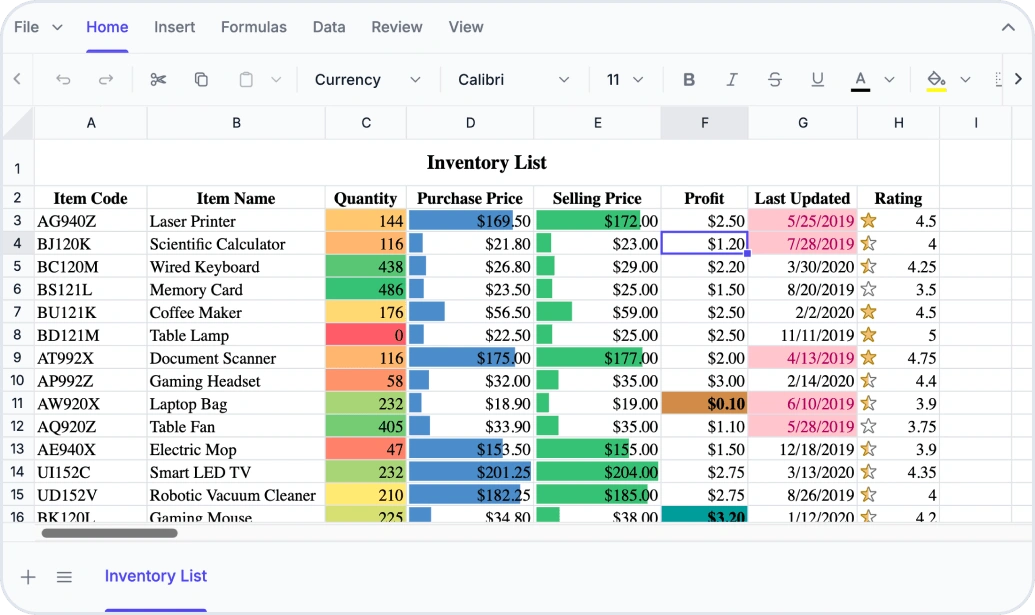
Conditional formatting and PDF export for the Blazor Spreadsheet Editor.
UI Component Suite
 Blazor
Build Next-Gen Web Applications
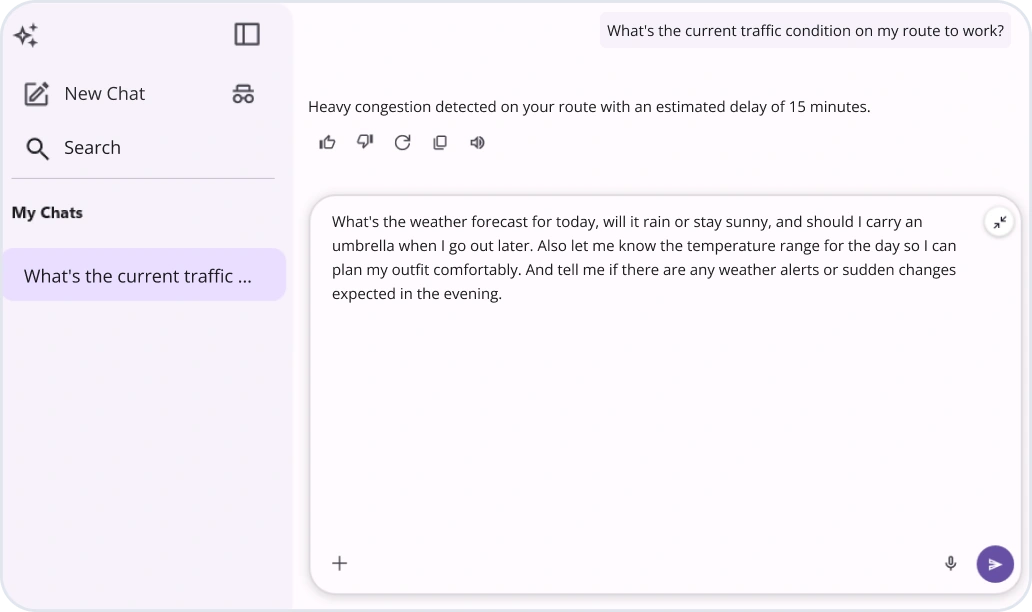
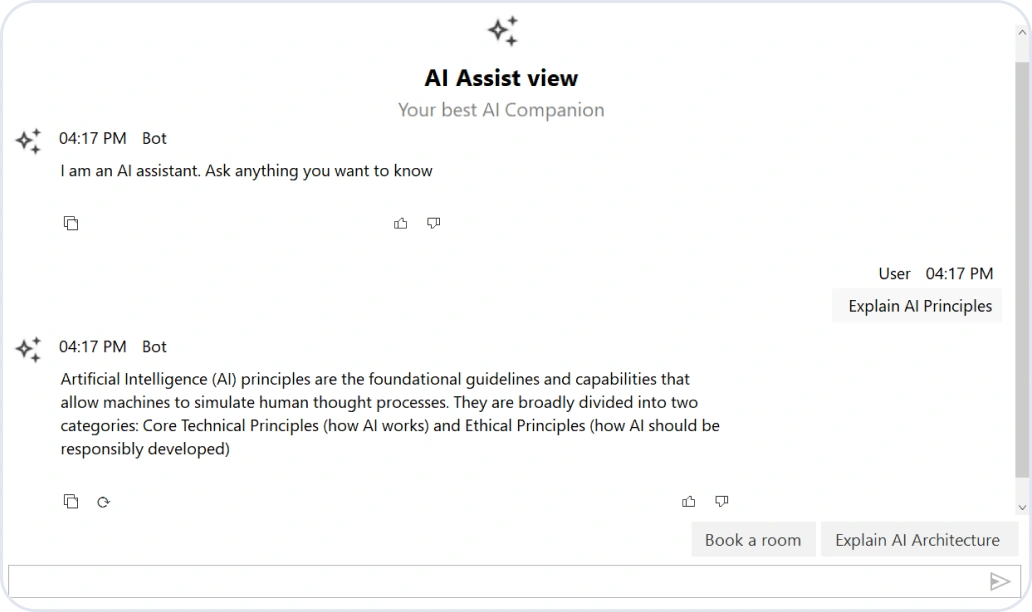
The new Inline AI Assist component provides inline and pop-up content AI assistance.
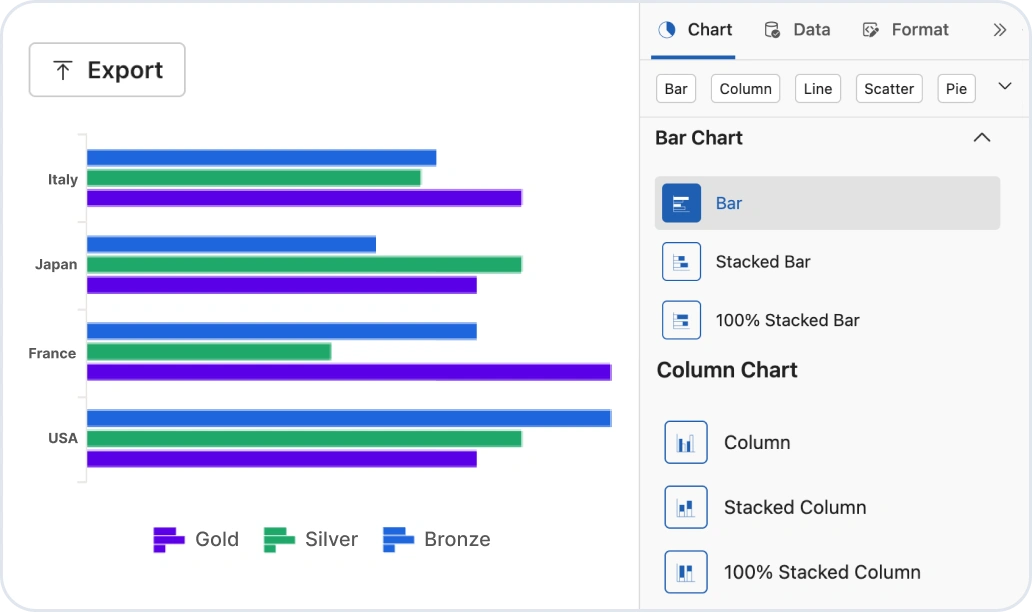
The Blazor Chart Wizard is now production-ready.
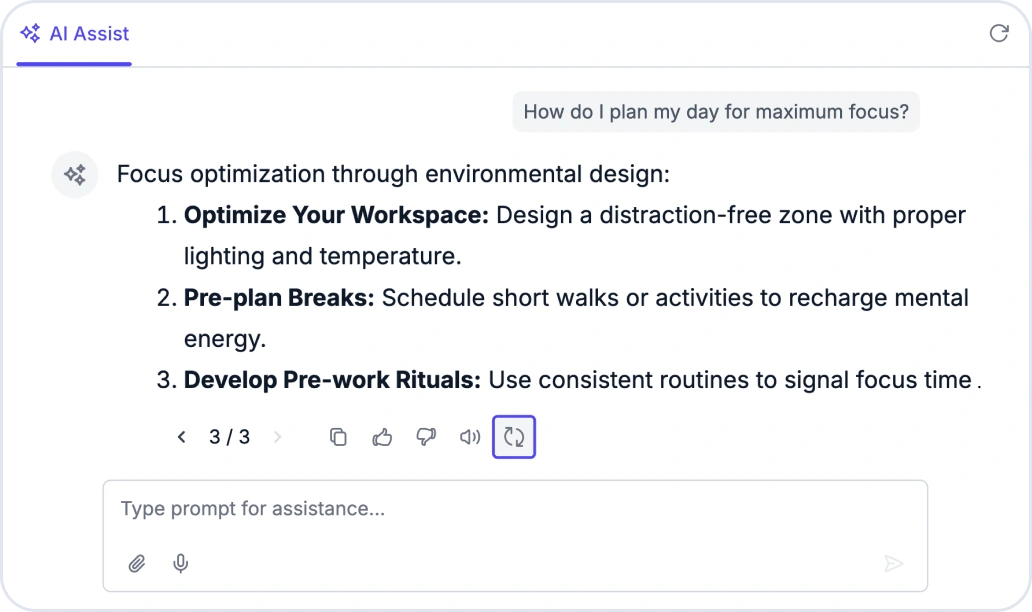
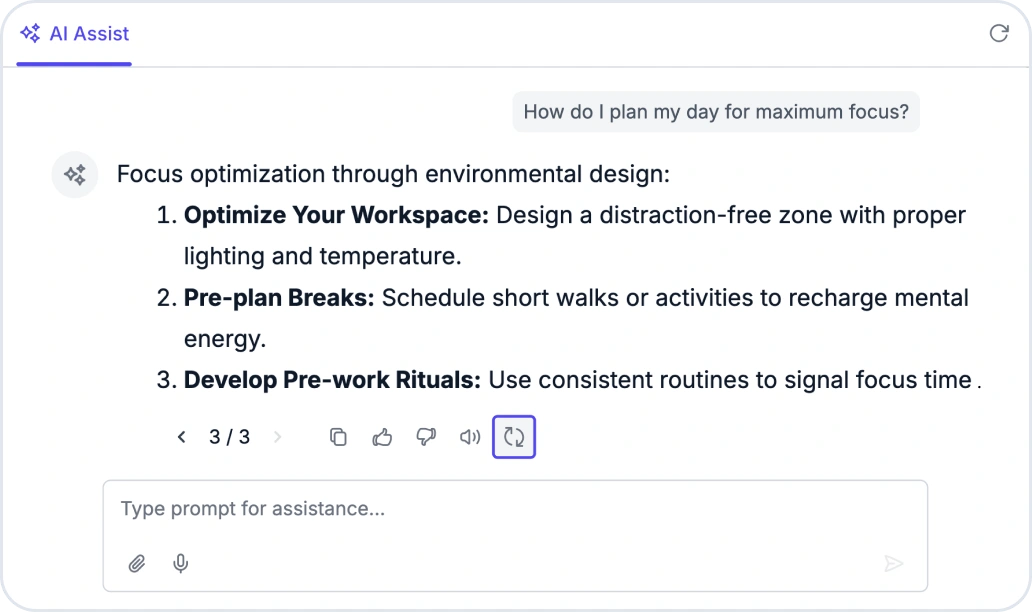
The AI AssistView gains speech input and response regeneration capabilities.
 React
ReactAccess a Complete Line of React Components
Production-ready Sankey Diagram, Pure React DataGrid, and Charts.
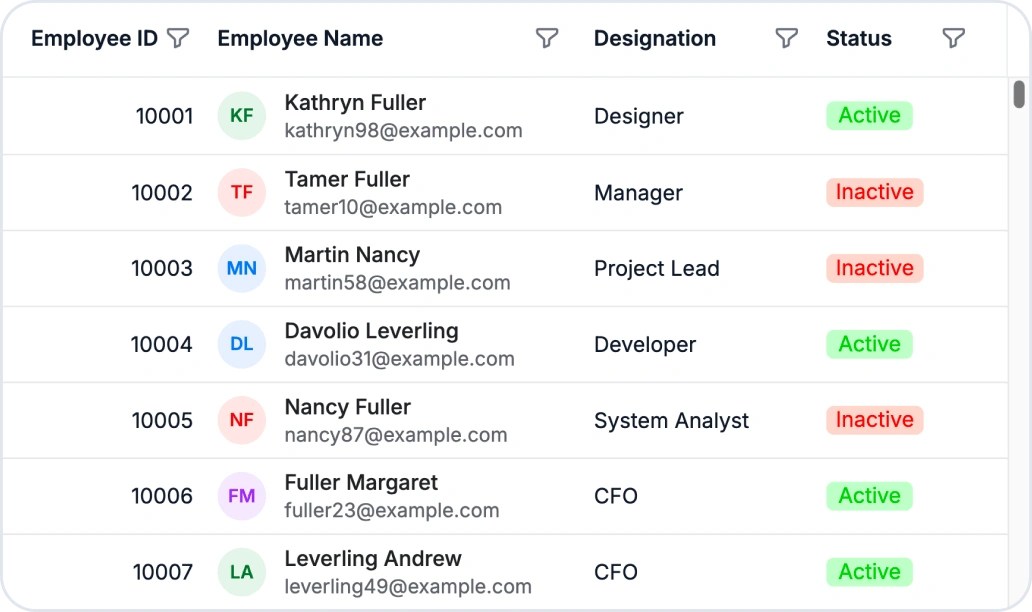
DOM virtualization, inline cell editing, and undo/redo for batch editing in the DataGrid.

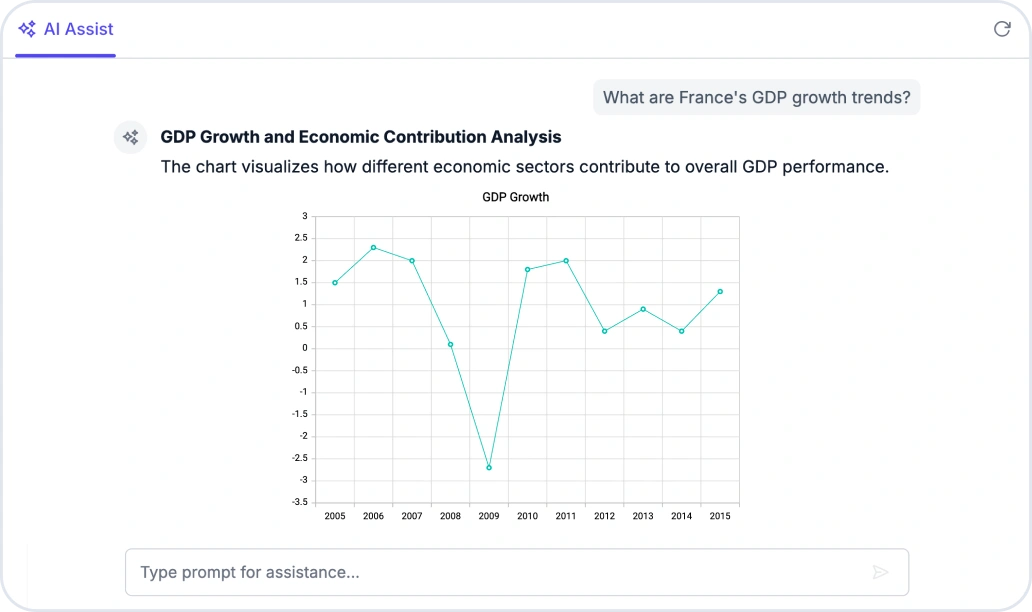
Generative UI, response regeneration, and chain-of-thought for the AI AssistView.
 Angular
Harness Angular for Impressive Web Apps

Generative UI, response regeneration, and chain-of-thought for the AI AssistView.

Built-in CRUD, advanced filtering, and richer analytical reporting for the Pivot Table.

DOM virtualization, inline cell editing, and undo/redo for batch editing in the DataGrid.
 JavaScript
Get the Most out of JavaScript

The Sankey Diagram is now production-ready for flow visualization.
Generative UI, response regeneration, and chain-of-thought for the AI AssistView.

Built-in CRUD, advanced filtering, and richer analytical reporting for the Pivot Table.
 Vue
VueCreate High-Performance Vue Apps
Generative UI, response regeneration, and chain-of-thought for the AI AssistView.
DOM virtualization, inline cell editing, and undo/redo for batch editing in the DataGrid.
Built-in CRUD, advanced filtering, and richer analytical reporting for the Pivot Table.
 ASP.NET Core
Publish Superior Web Applications

The Sankey Diagram is now production-ready for flow visualization.
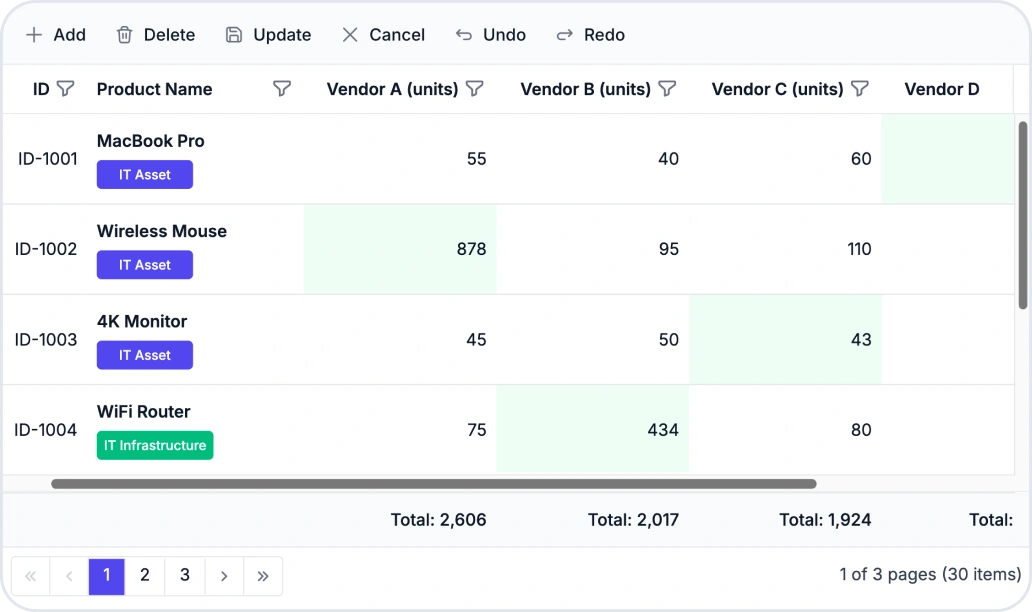
DOM virtualization, inline cell editing, and undo/redo for batch editing in the DataGrid.
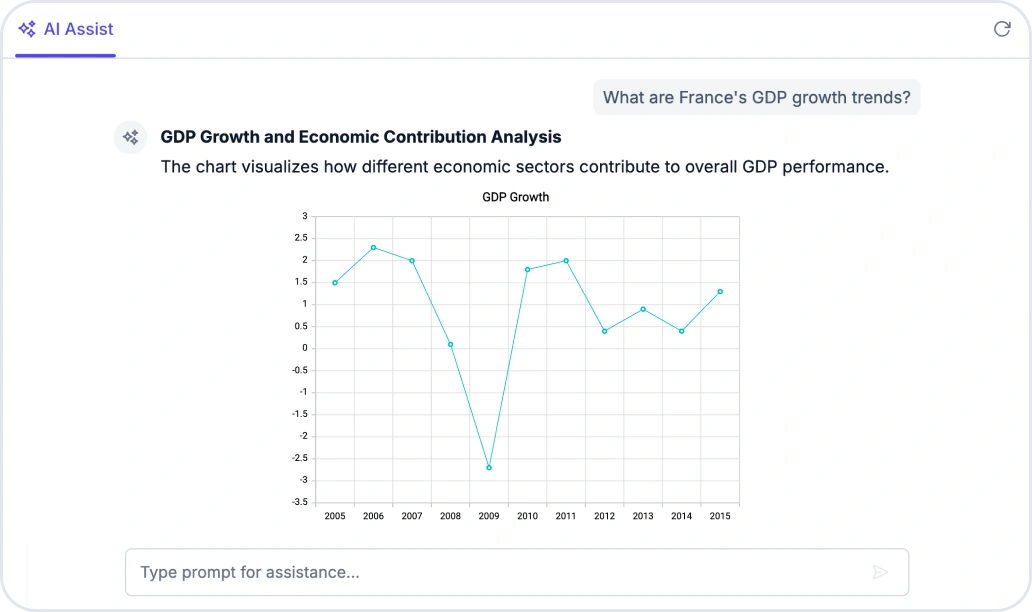
Generative UI, response regeneration, and chain-of-thought for the AI AssistView.
 ASP.NET MVC
Build Powerful Web Apps

The Sankey Diagram is now production-ready for flow visualization.
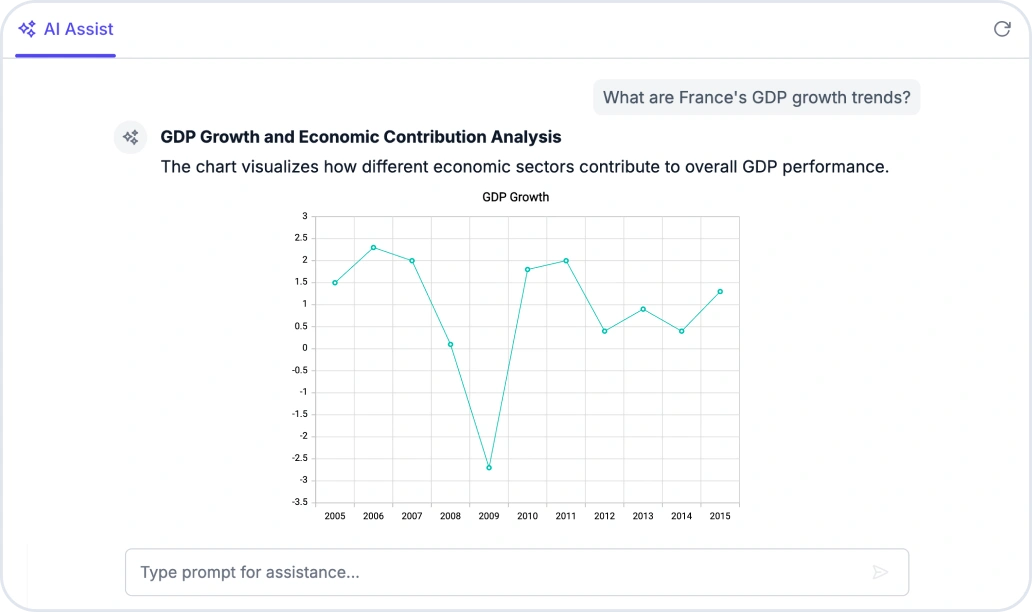
Generative UI, response regeneration, and chain-of-thought for the AI AssistView.
DOM virtualization, inline cell editing, and undo/redo for batch editing in the DataGrid.
 .NET MAUI
Build Cross-Platform Apps
The prompt input box is resizable in the AI AssistView.
Undo and redo, UI search, and multi-row dragging for the DataGrid.
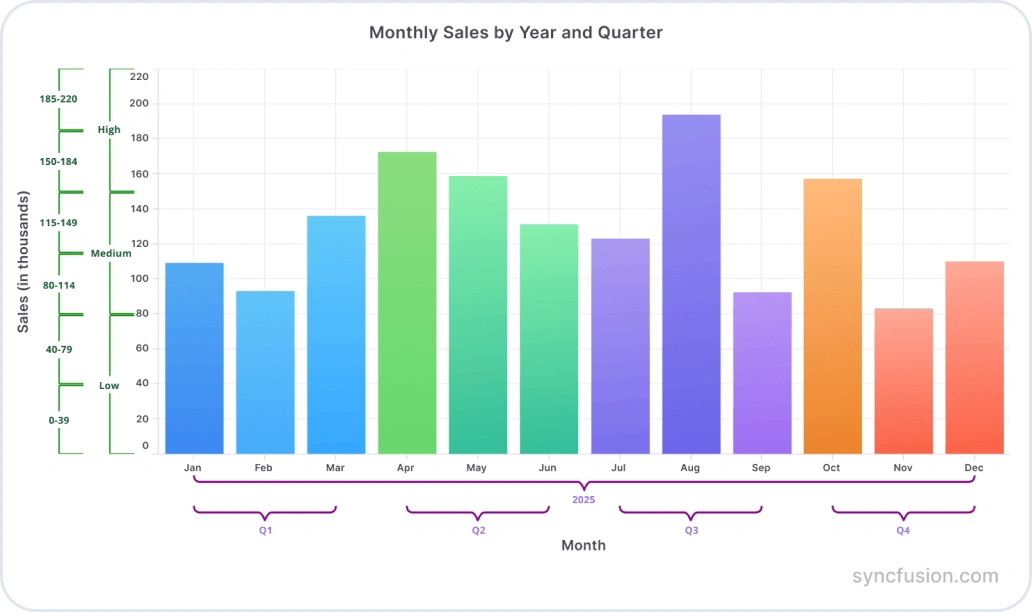
The Charts component now supports multilevel axis labels.
 WinForms
Create Better Apps
Built-in response toolbar for faster AI interactions in the AI AssistView.

Stop-responding button for better AI response control in the AI AssistView.

COUNTIF formulas accelerated by up to 95% in the Calculation Engine.
 WPF
WPFTake Control of the Desktop
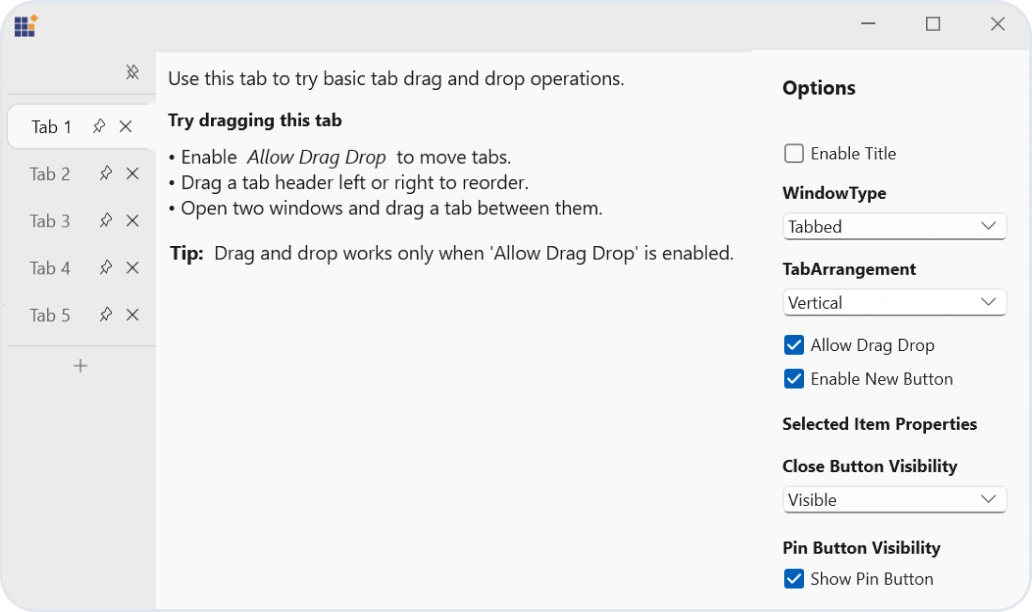
Tear-off windows, pinned tabs, and vertical layouts for the TabControl.
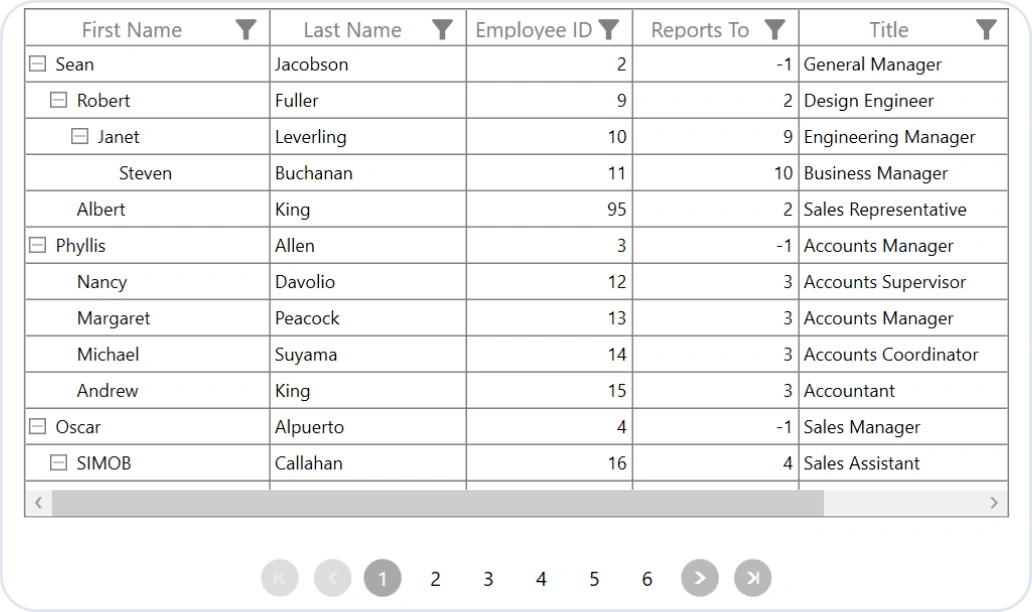
Paging and search highlighting for large datasets in the TreeGrid.
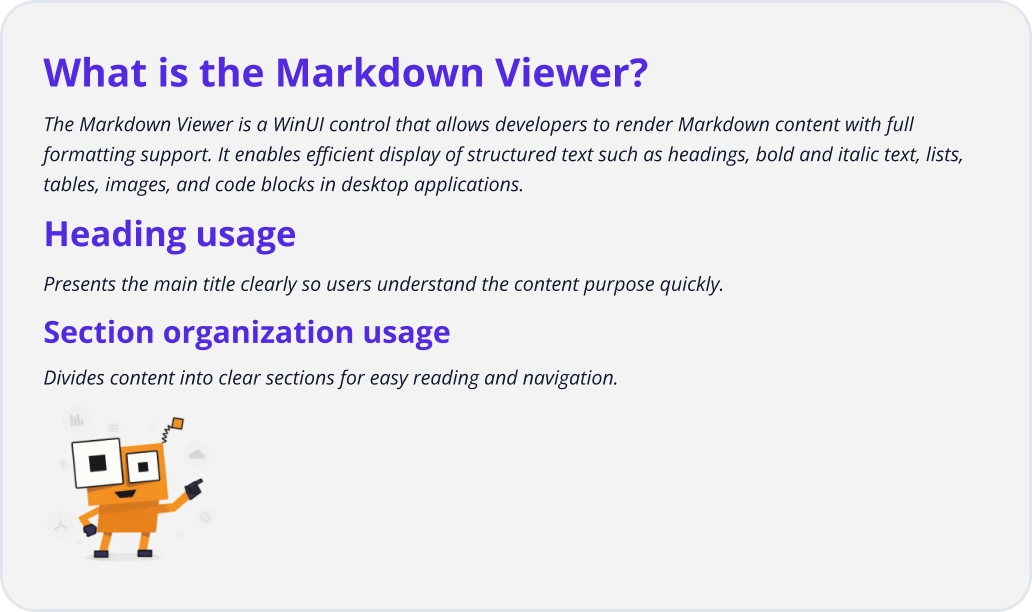
Customizable element styling to match application themes in the Markdown Viewer.
 WinUI
WinUIDevelop Windows apps with advanced technology
The new Markdown Viewer converts markdown input into a fully formatted visual representation.