ESSENTIAL STUDIO® 2025 VOLUME 4
What’s New in Essential JS 2
2025 Volume 4 for JavaScript delivers a new table block in the Block Editor, pinned rows in the Data Grid, plus large-icon customization and sequential uploading in the File Manager.
Common
Production-ready components
The following components have been developed to meet industry standards and are now marked as production-ready for JavaScript:
- Smart Paste: A button component that provides automatic text formatting, validation, and seamless integration with various form components.
- Smart TextArea: A text area component that offers intelligent autocomplete suggestions.
- Chat UI: A responsive chat interface with real-time messaging and a customizable design.
Generate individual scripts
The custom resource generator now allows users to generate component scripts and their dependent libraries as separate script files.
AI AssistView
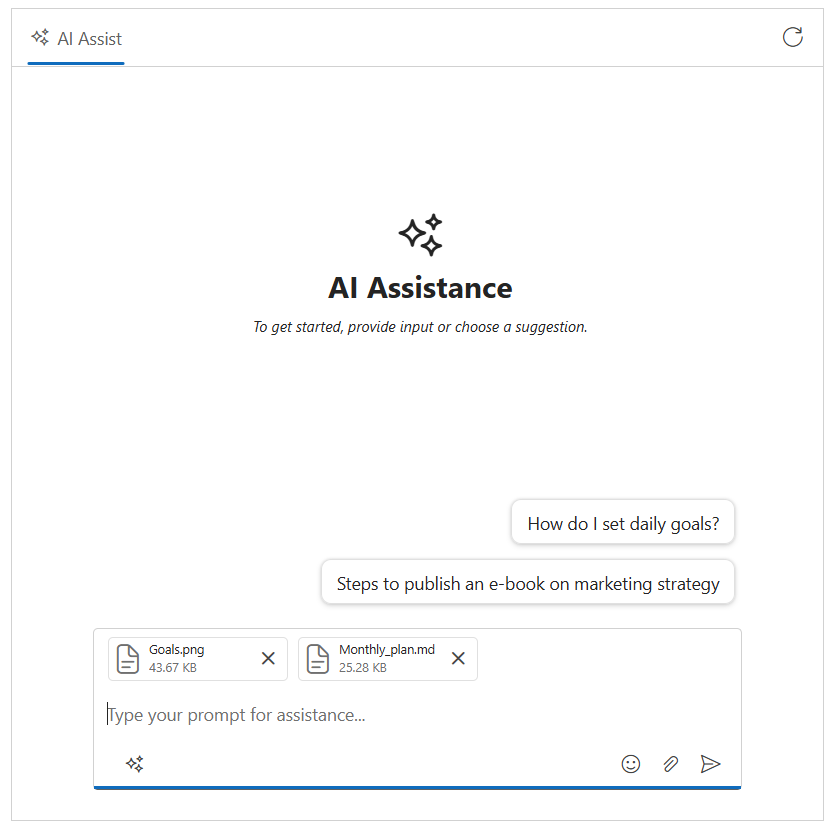
Footer toolbar
The AI AssistView component now supports a footer toolbar for composing prompts with single-line and multiple-line input modes that extend dynamically while typing long-form entries. The toolbar is fully declarative and extensible, offering built-in actions such as send, attach, and clear, along with support for custom items. Developers can define item order, icons, tooltips, and handle actions to create a tailored user experience for their AI-driven workflow. The toolbar also supports inline and bottom modes, providing flexibility in UI placement for different application layouts.
Find the demo link here.
Block Editor
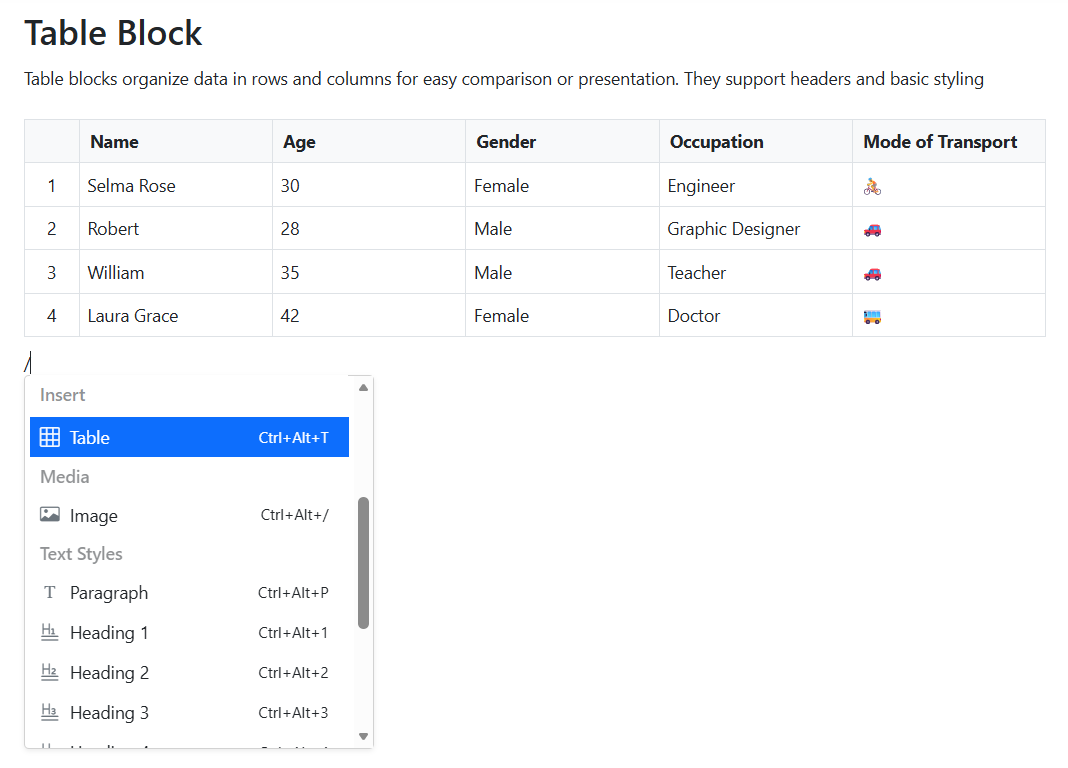
Table block
The Block Editor now includes a dedicated table block for creating and editing tabular content within the block-based authoring surface. Developers can insert tables, select cells, and format content using keyboard shortcuts, while also using slash commands inside table cells to insert other blocks or actions quickly without leaving the table. To simplify table management, dot and plus buttons are displayed at the top for adding columns and on the left for adding rows. A delete button appears when clicking the row or column gripper area for easy removal.
Find the demo link here.
Charts
Axis label templates
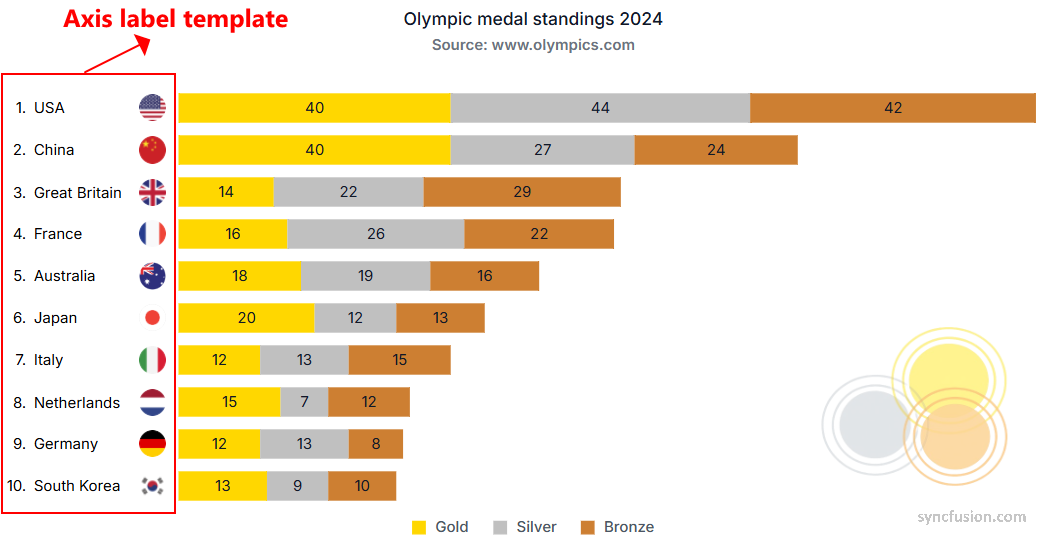
Users can now use templated axis labels in the Charts component. This feature enables rendering axis tick labels using custom HTML to present formatted numbers, multi-line text, unit symbols, badges, or localized content. Templates can be applied per axis and work with category, numeric, logarithmic, and date-time axes.
Templates are subject to existing label behaviors such as smart placement, trimming, rotation, and multi-level labels. For best performance, keep templates lightweight; heavy DOM or complex pipes may impact rendering time when plotting many points. During exporting and printing, the textual content produced by the template is used for output compatibility.
Find the demo link here.
Chat UI
File attachments in conversations
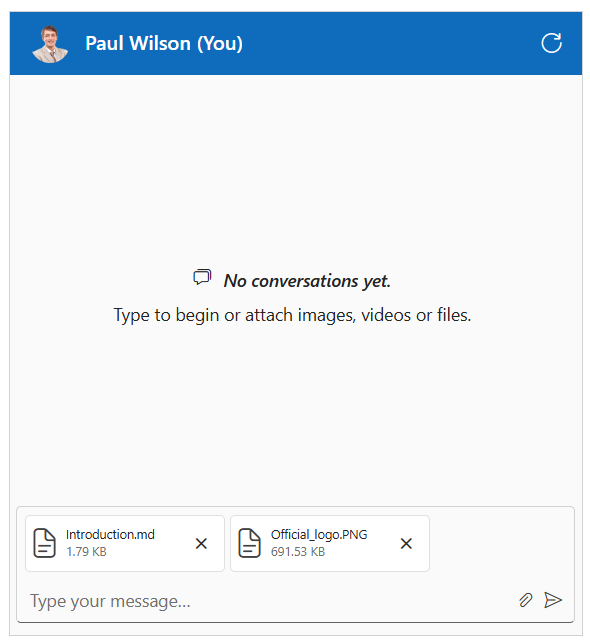
The Chat UI component now supports sending, receiving, previewing, and downloading file attachments within chat conversations. Common file types for images, documents, PDFs, and videos are displayed as message bubbles with thumbnails for quick identification. This feature improves real-time collaboration, enables faster knowledge sharing, and streamlines workflows for scenarios like customer support, team communication, and field reporting.
Highlights:
- Compatible with major file formats including JPG, PNG, PDF, DOCX, and MP4.
- Inline previews for images.
- Secure download options for all attachments.
Find the demo link here.
File Manager
Template for large icons view
The template enables customization of how files and folders render in the large icons view. It receives the item context (such as name, type, size, and modified date) so users can display thumbnails, badges, or additional metadata, and wire actions like quick menus or previews. This is useful for media libraries, document portals, and scenarios that benefit from rich visual presentation of items.
Find the demo link here.
![]()
Sequential upload
This feature ensures that files and folders are uploaded one at a time, rather than simultaneously. Sequential upload helps manage bandwidth efficiently and provides a predictable upload order, which is essential for workflows that require controlled file processing or server-side validation.
Find the demo link here.
Gantt Chart
Frozen columns
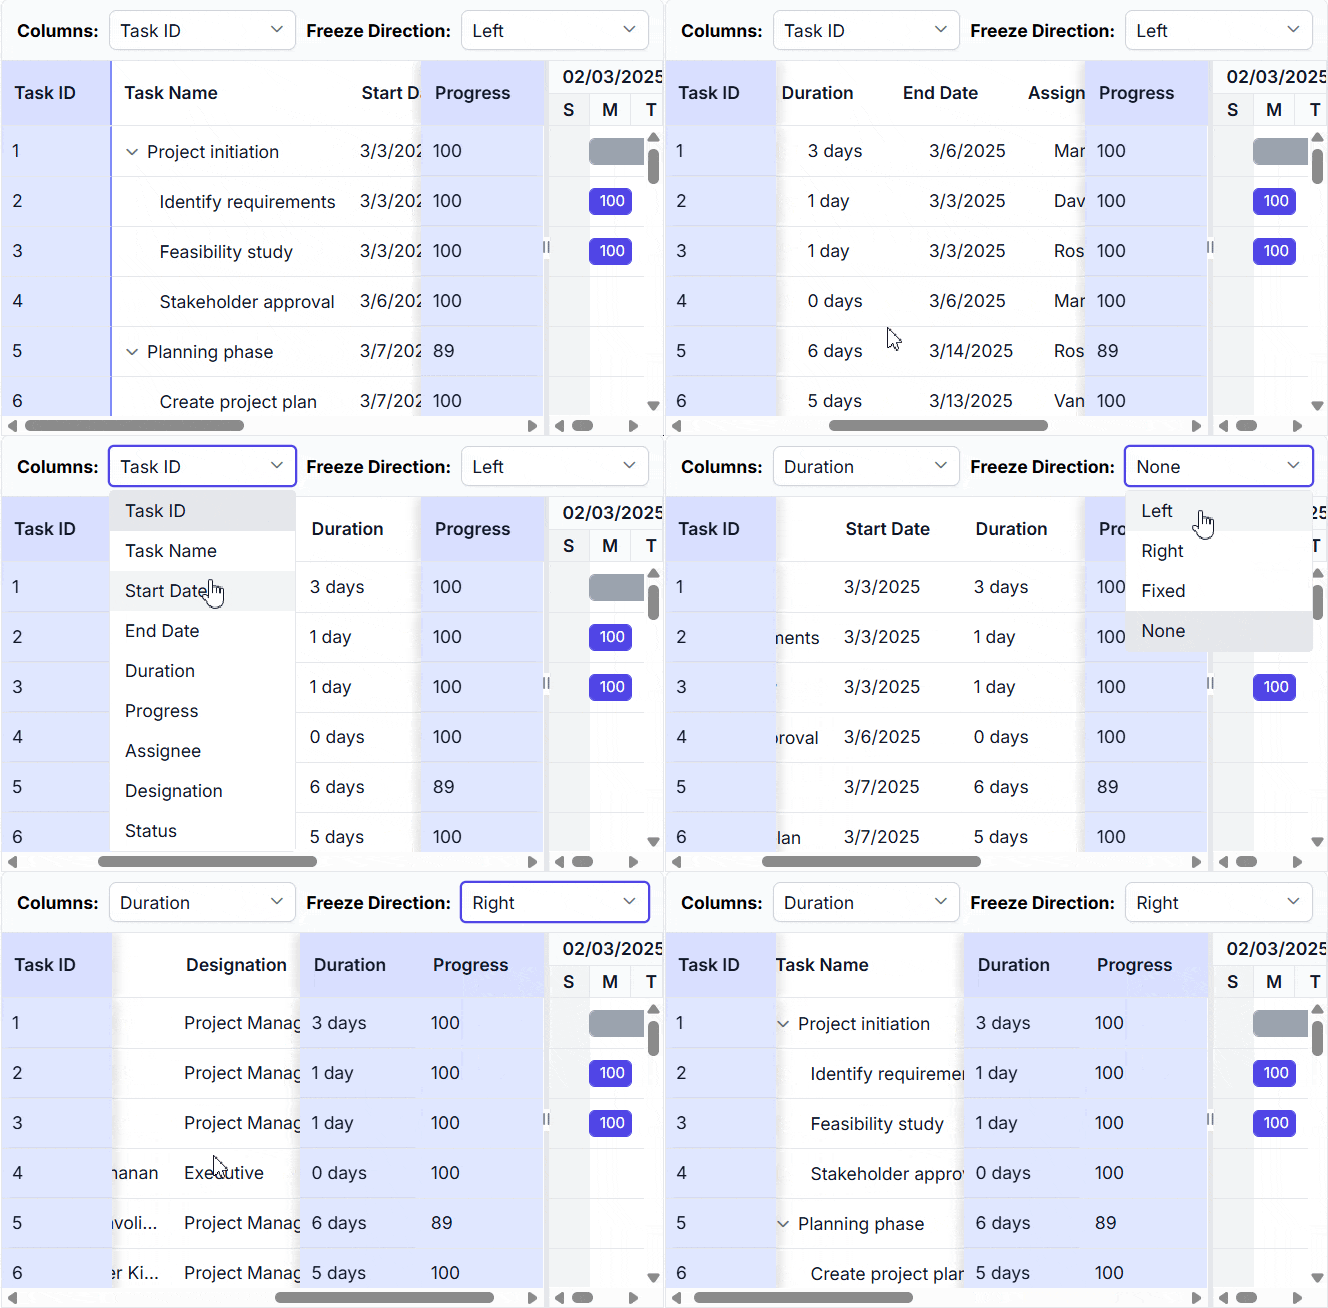
Frozen columns enhance readability in the Gantt Chart by keeping selected columns fixed while scrolling horizontally. This ensures that key details, such as task identifiers or names, remain visible at all times for easier project tracking.
Find the demo link here.
Data Grid
Conditional row selection
This feature allows rows to be selected only when specific criteria are met. If the condition is not satisfied, selection is disabled. This ensures that “Select All” includes only the rows that satisfy the defined rules, providing accurate and controlled selection across the dataset.
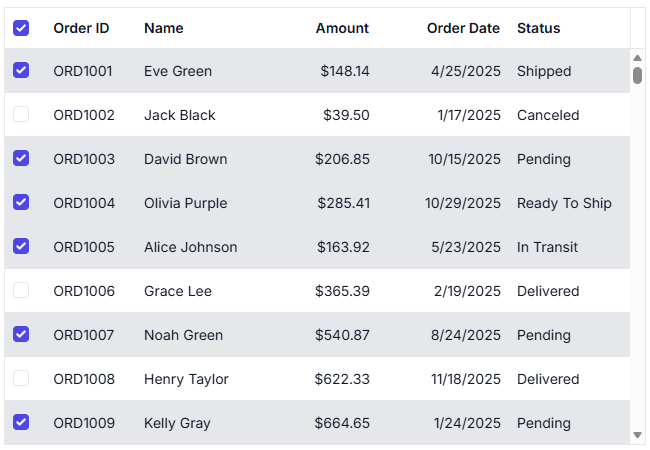
JavaSCript demo for Data Grid with specific row selection
Pinned rows
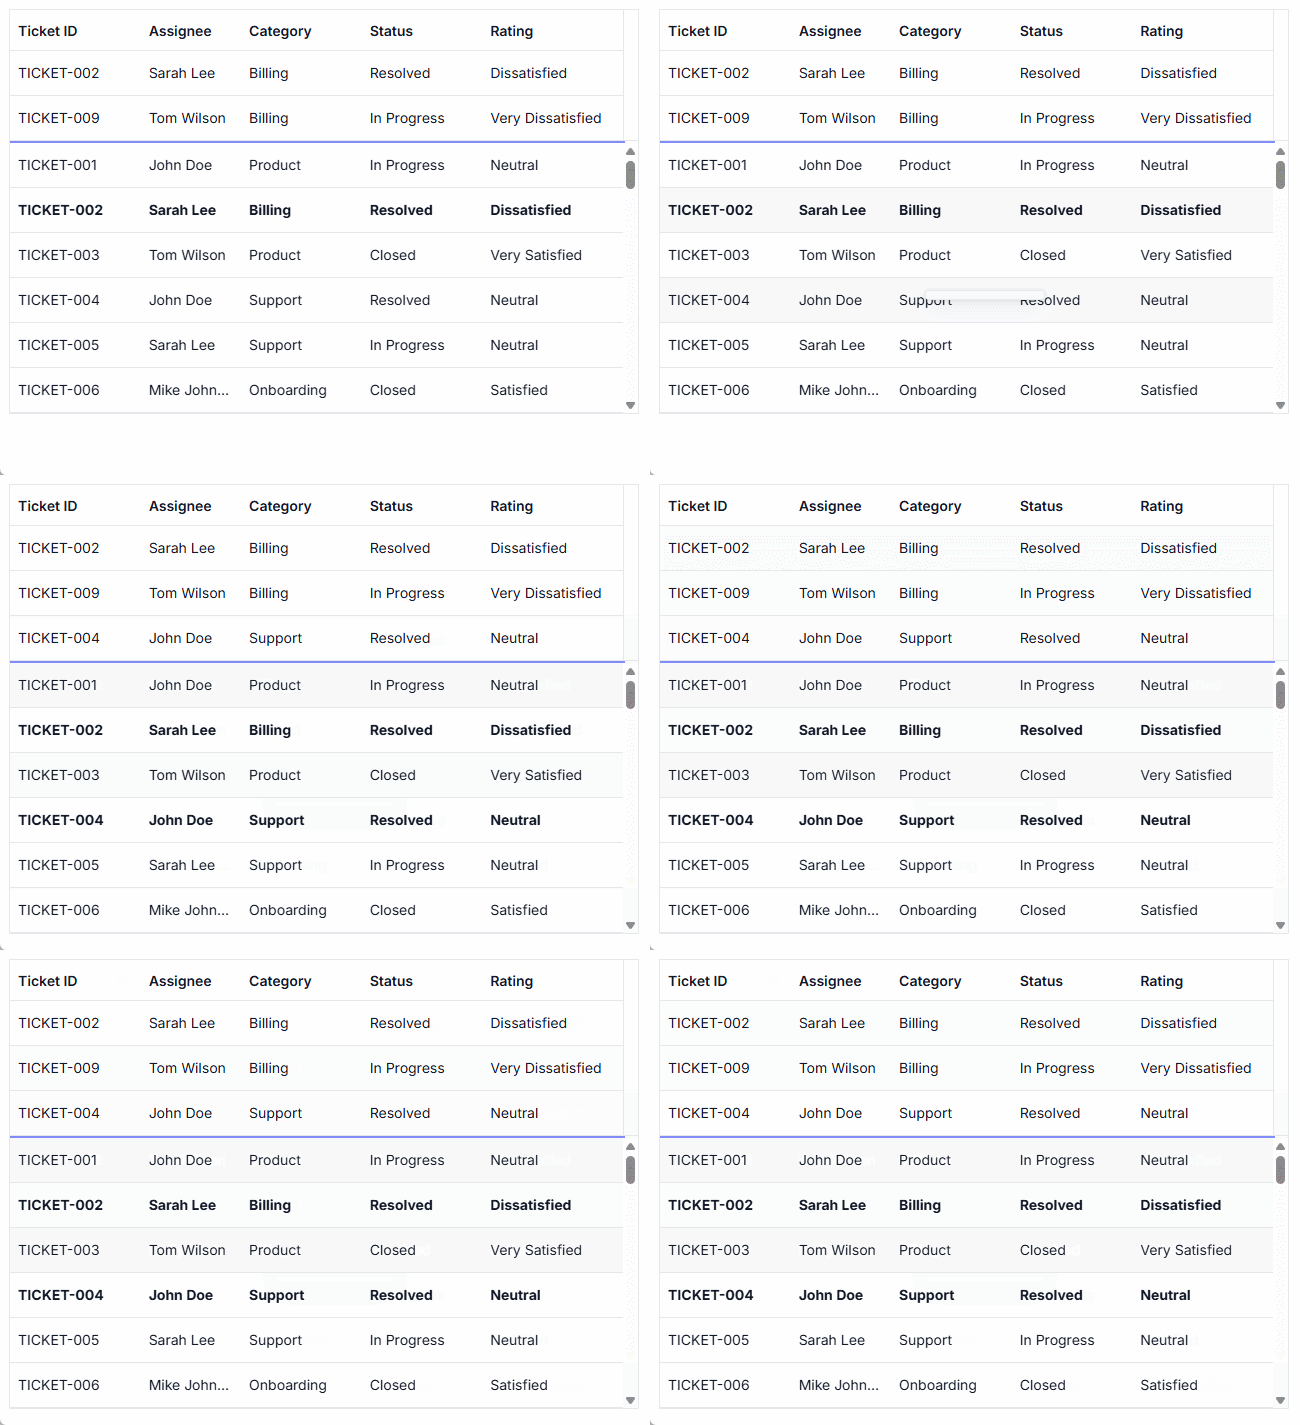
Pinned rows keep specific rows fixed at the top of the grid. This enhancement ensures that key records remain visible during operations such as paging, sorting, and filtering, providing continuous accessibility across all data interactions.
Inputs
Add adornments to input fields
The JavaScript Input components—TextBox, Numeric TextBox, Input Mask, and TextArea—support prefix and suffix adornments. These adornments enable the integration of icons, buttons, labels, or custom elements directly within the input boundaries. Users can attach events to adornments for actions, such as clearing content, toggling formats, or displaying validation indicators. This support is compatible with existing themes and floating labels, introducing no breaking changes. Prerequisites include setting up the standard component via the npm installation. Adornments enhance form usability in applications like user registration (e.g., country code prefixes in Input Mask), financial interfaces (e.g., currency symbols in Numeric TextBox), and content editors (e.g., character counters in TextArea). Positioning adapts to component-specific elements, such as spin buttons or resizable areas, ensuring consistent behavior across devices.
Explore demos:
JavaScript TextBox Adornments | JavaScript Numeric TextBox Adornments |
JavaScript Input Mask Adornments | JavaScript TextArea Adornments.

Pivot Table
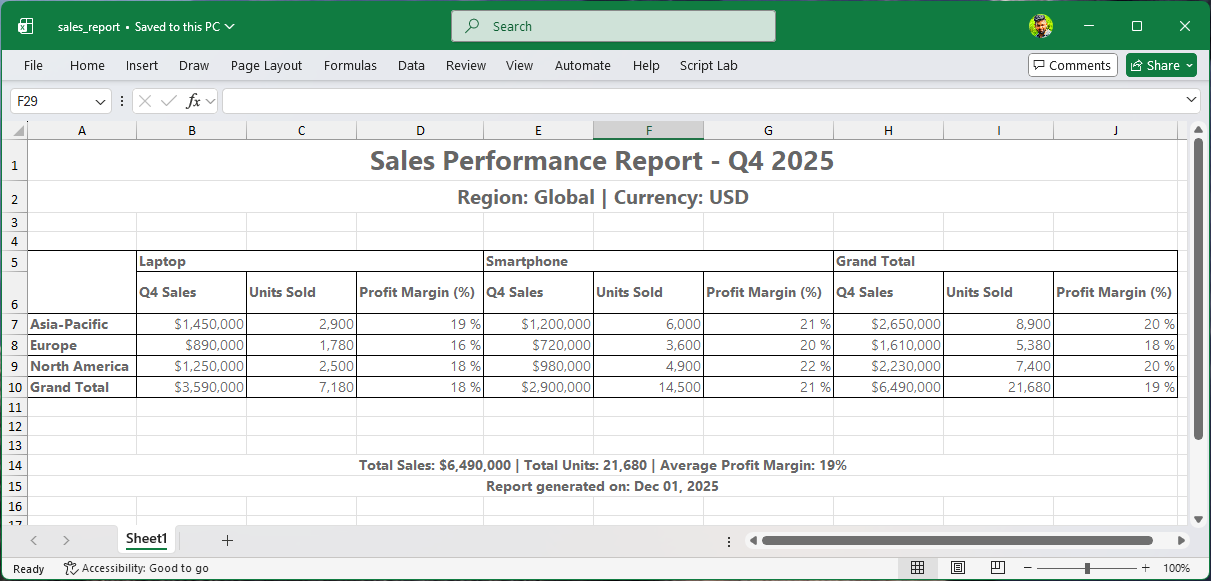
Enhanced engine-based Excel export
The Pivot Table now offers enhanced engine-based Excel export with powerful customization options for a seamless and standardized experience.
Key features
- Custom headers and footers: Add branding and metadata to exported files.
- Custom data source binding: Modify pivot values before export.
- Custom aggregates & date formats: Apply formulas and locale-specific formats.
- Cell and row spanning: Preserve merged cells for better layout fidelity.
- Export hidden columns & multiple tables: Export to single or separate sheets.
- Column customization: Rename, reorder, or exclude columns during export.
- Custom file name: Define the name of the exported Excel file.
- Styling options: Apply font, color, and conditional formatting.
- Rotated header text: Optimize header layout.
- Blob export support: Generate Excel files for advanced workflows.
- Fully compatible with virtualization, paging, and RTL layouts.
This update delivers a unified, feature-rich Excel export solution for Pivot Table users, enhancing usability and consistency.
Rich Text Editor
AI assistant
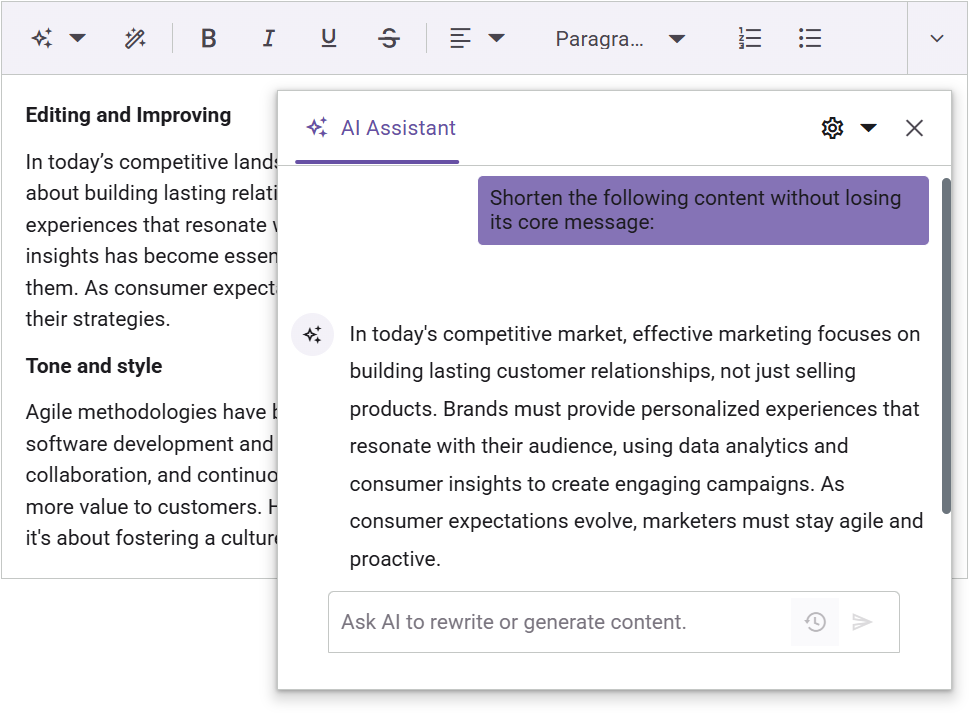
The Rich Text Editor control integrates an AI Assistant to enhance content creation with real-time grammar corrections, tone adjustments, formatting suggestions, and intelligent writing recommendations through a dedicated toolbar. It also supports custom prompts for generating tailored content based on user input.
Auto formatting for Markdown syntax
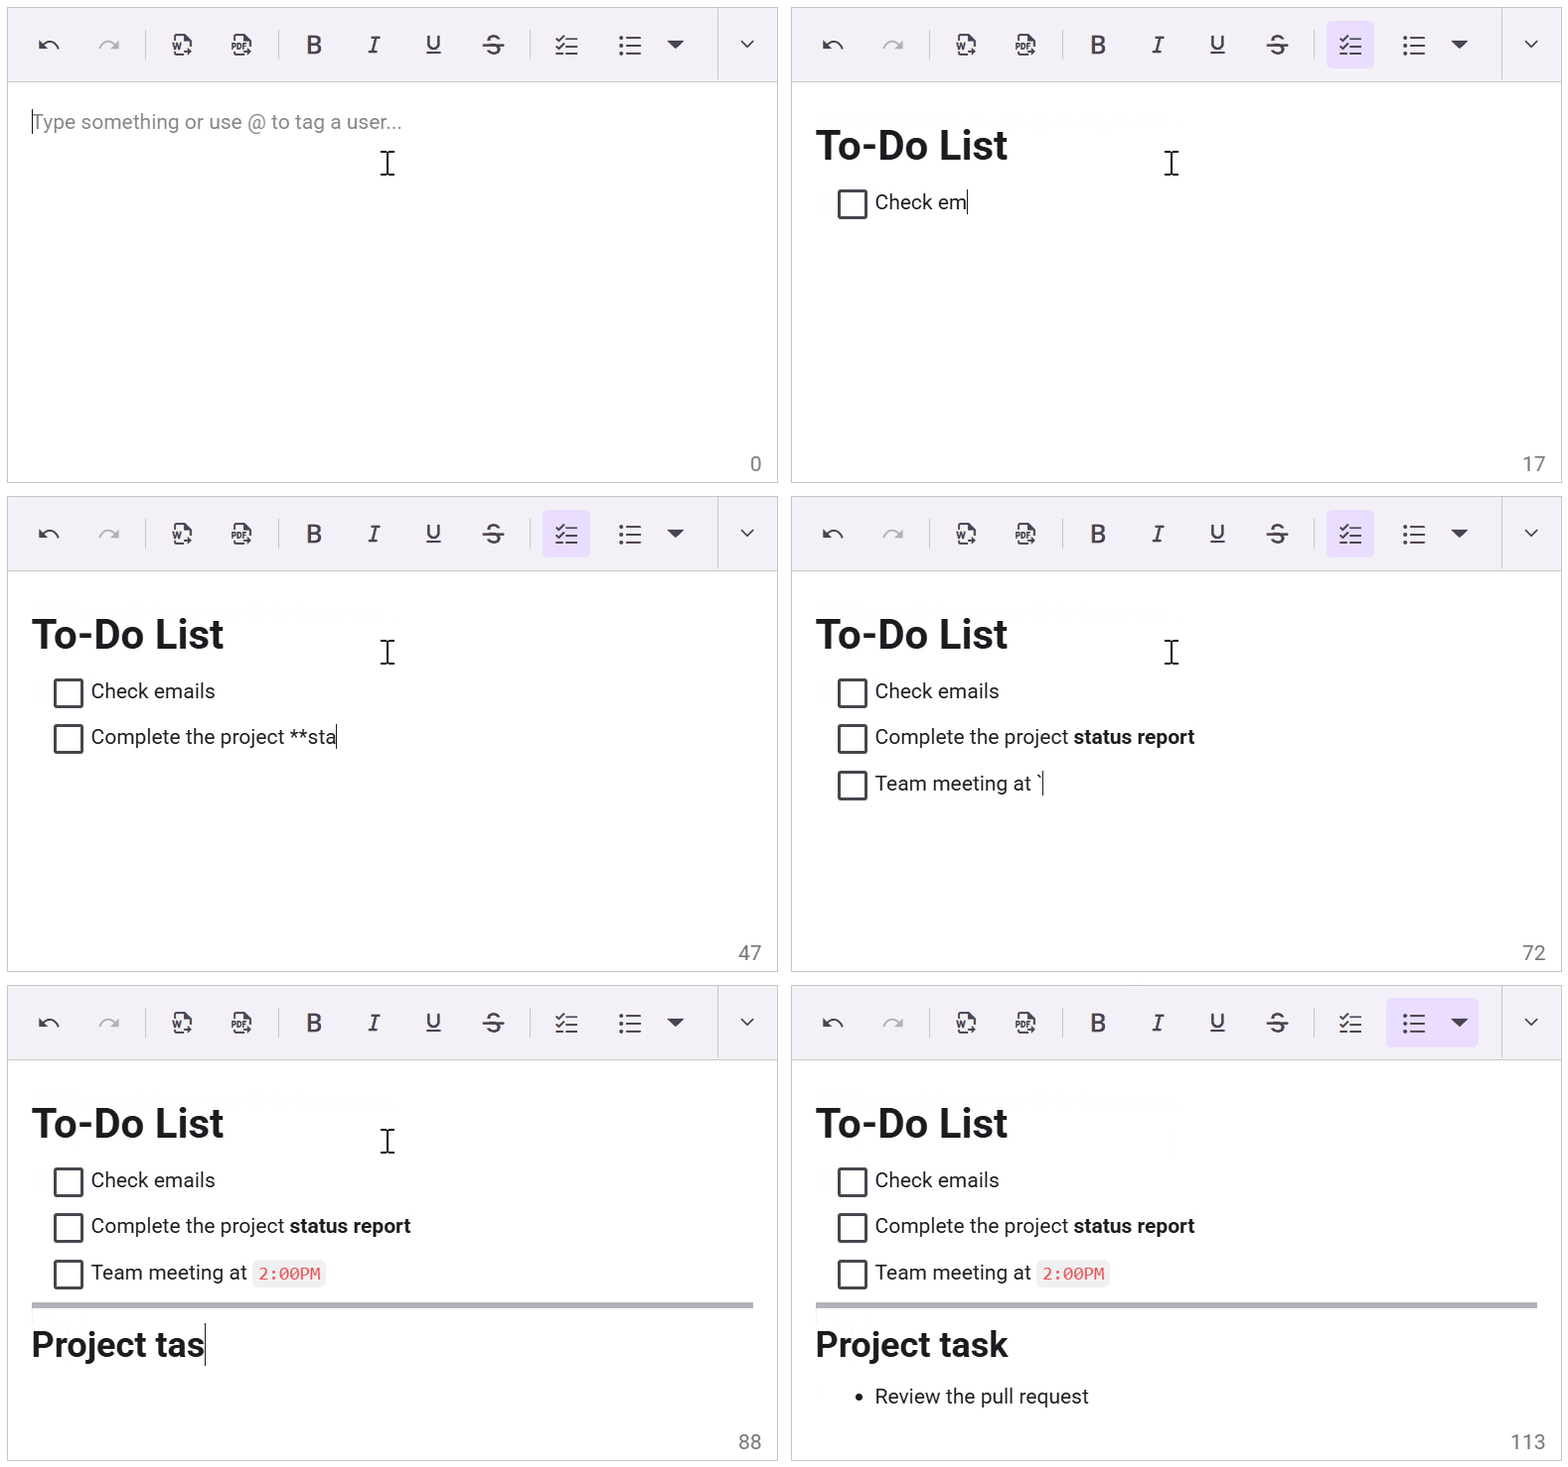
This feature lets users get and set Markdown content in the HTML editor for seamless format conversion. It introduces auto-formatting of Markdown syntax in the editor, instantly rendering elements like headings (#), bold (*), and italics () as formatted HTML.
View the Auto formatting for Markdown syntax demo
Line height
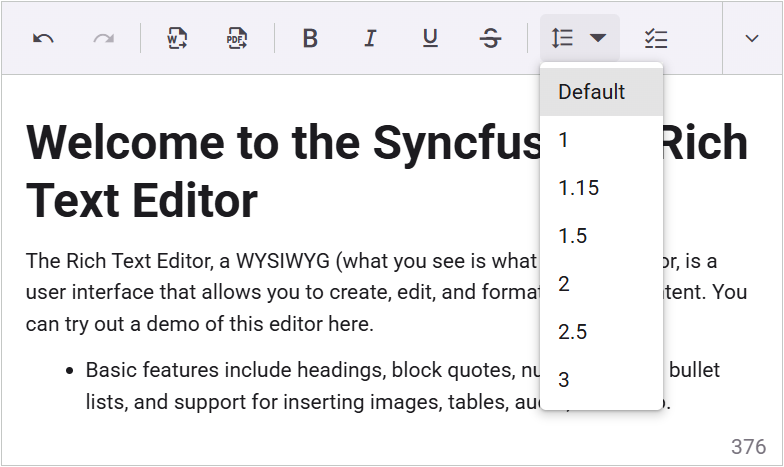
The line height feature lets users adjust the vertical spacing between lines of text, giving them control over how tightly or loosely the text is packed within paragraphs. This helps improve readability and visual balance in the content layout.
Manage copy content
The feature streamlines content management by stripping unwanted styles when copying HTML, ensuring clean output while preserving text formatting such as font styles, colors, and alignments within the editor.
Enhance import/export security for Word and PDF
This feature enables the passing of authorization tokens during Word document imports and when exporting to PDF or Word formats. It ensures secure document access by validating user permissions during both import and export operations.
Tree Grid
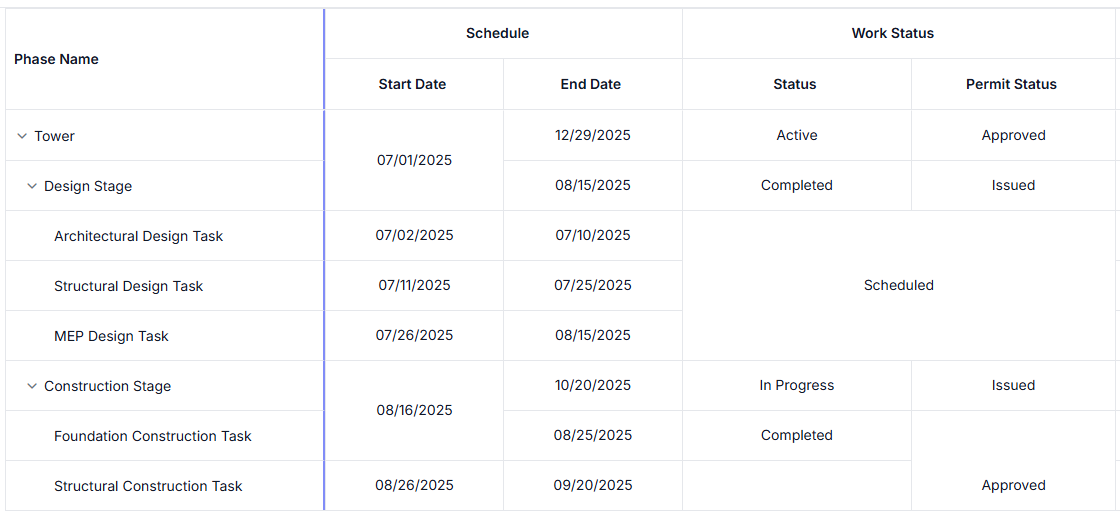
Row and column spanning
This feature automatically merges adjacent cells that contain the same value. Identical values are displayed as a single, unified cell across both rows and columns, improving readability and reducing redundancy in hierarchical data.
