Overview
The .NET MAUI histogram is a chart that visually represents the distribution of a dataset. It is commonly used in statistical analysis to show the frequency distribution of continuous or discrete datasets. Histograms are effective tools for understanding the characteristics of a dataset because they provide valuable insights into the distribution and patterns present in the data.
.NET MAUI Histogram Chart documentation

Key features
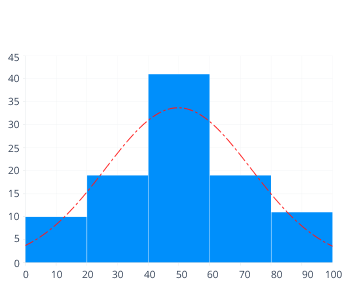
Distribution curve
A visual portrayal of a normal distribution of data using the .NET MAUI Histogram.
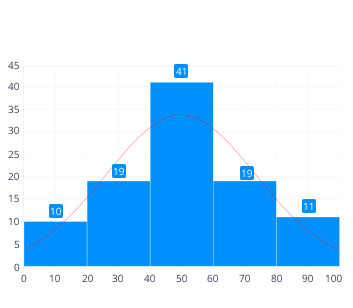
Data labels
Enhancing readability is simplified by conveniently annotating data points with data labels.
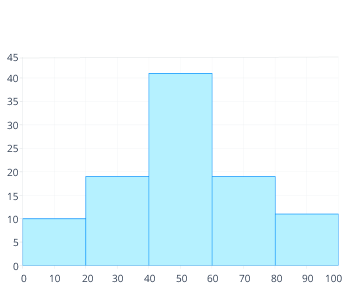
UI styling
Customize the color and border of histograms using built-in APIs to make them visually unique.
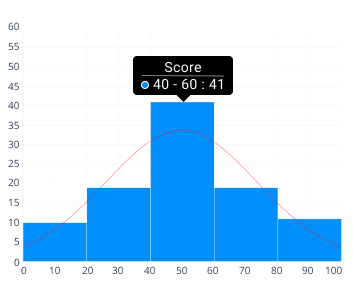
Tooltip
Tooltips provide relevant information based on the histogram’s interval, enhancing the understanding of the presented data when users hover over or tap specific data points.
Code example
<ContentPage xmlns="http://schemas.microsoft.com/dotnet/2021/maui"
        xmlns:x="http://schemas.microsoft.com/winfx/2009/xaml"
        x:Class="ChartExample.MainPage"
        xmlns:local="clr-namespace:ChartExample"
        xmlns:chart="clr-namespace:Syncfusion.Maui.Charts;assembly=Syncfusion.Maui.Charts">

    <Grid>
        <chart:SfCartesianChart HorizontalOptions="FillAndExpand" VerticalOptions="FillAndExpand">
            <!--Setting BindingContext-->
            <chart:SfCartesianChart.BindingContext>
                <local:ViewModel/>
            </chart:SfCartesianChart.BindingContext>

            <!--Initialize the horizontal axis for the .NET MAUI Cartesian Chart.-->
            <chart:SfCartesianChart.XAxes>
                <chart:NumericalAxis/>
            </chart:SfCartesianChart.XAxes>

            <!--Initialize the vertical axis for the .NET MAUI Cartesian Chart.-->
            <chart:SfCartesianChart.YAxes>
                <chart:NumericalAxis/>
            </chart:SfCartesianChart.YAxes>

            <!--Adding Histogram Series to the .NET MAUI Cartesian Chart.-->
            <chart:HistogramSeries
                        ItemsSource="{Binding Data}"
                        XBindingPath="XValue"
                        YBindingPath="YValue"
                        HistogramInterval="20">
            </chart:HistogramSeries>
        </chart:SfCartesianChart>
    </Grid>
</ContentPage>
public class Model
{
public string XValue { get; set; }
public double YValue { get; set; }
public Model(string xValue, double yValue)
{
XValue = xValue;
YValue = yValue;
}
}
public class ViewModel
{
public ObservableCollection<Model> Data { get; set; }
public ViewModel()
{
Data = new ObservableCollection<Model>()
{
new Model(5.250, 0),
new Model(7.750, 0),
new Model(0, 0),
new Model(8.275, 0),
new Model(9.750, 0),
new Model(7.750, 0),
new Model(8.275, 0),
new Model(6.250, 0),
new Model(5.750, 0),
new Model(5.250, 0),
new Model(23.000, 0),
new Model(26.500, 0),
new Model(27.750, 0),
new Model(25.025, 0),
new Model(26.500, 0),
new Model(26.500, 0),
new Model(28.025, 0),
new Model(29.250, 0),
new Model(26.750, 0),
new Model(27.250, 0),
new Model(26.250, 0),
new Model(25.250, 0),
new Model(34.500, 0),
new Model(25.625, 0),
new Model(25.500, 0),
new Model(26.625, 0),
new Model(36.275, 0),
new Model(36.250, 0),
new Model(26.875, 0),
new Model(45.000, 0),
new Model(43.000, 0),
new Model(46.500, 0),
new Model(47.750, 0),
new Model(45.025, 0),
new Model(56.500, 0),
new Model(56.500, 0),
new Model(58.025, 0),
new Model(59.250, 0),
new Model(56.750, 0),
new Model(57.250, 0),
new Model(46.250, 0),
new Model(55.250, 0),
new Model(44.500, 0),
new Model(45.500, 0),
new Model(55.500, 0),
new Model(45.625, 0),
new Model(55.500, 0),
new Model(56.250, 0),
new Model(46.875, 0),
new Model(43.000, 0),
new Model(46.250, 0),
new Model(55.250, 0),
new Model(44.500, 0),
new Model(45.425, 0),
new Model(56.625, 0),
new Model(46.275, 0),
new Model(56.250, 0),
new Model(46.875, 0),
new Model(43.000, 0),
new Model(46.250, 0),
new Model(55.250, 0),
new Model(44.500, 0),
new Model(45.425, 0),
new Model(55.500, 0),
new Model(46.625, 0),
new Model(56.275, 0),
new Model(46.250, 0),
new Model(56.250, 0),
new Model(42.000, 0),
new Model(41.000, 0),
new Model(63.000, 0),
new Model(66.500, 0),
new Model(67.750, 0),
new Model(65.025, 0),
new Model(66.500, 0),
new Model(76.500, 0),
new Model(78.025, 0),
new Model(79.250, 0),
new Model(76.750, 0),
new Model(77.250, 0),
new Model(66.250, 0),
new Model(75.250, 0),
new Model(74.500, 0),
new Model(65.625, 0),
new Model(75.500, 0),
new Model(76.625, 0),
new Model(76.275, 0),
new Model(66.250, 0),
new Model(66.875, 0),
new Model(82.000, 0),
new Model(85.250, 0),
new Model(87.750, 0),
new Model(92.000, 0),
new Model(85.250, 0),
new Model(87.750, 0),
new Model(89.000, 0),
new Model(88.275, 0),
new Model(89.750, 0),
new Model(95.750, 0),
new Model(95.250, 0)
};
}
}Learning resources


.NET MAUI Histogram Chart User Guide
Learn more about the available options to customize .NET MAUI histogram charts.
