Overview
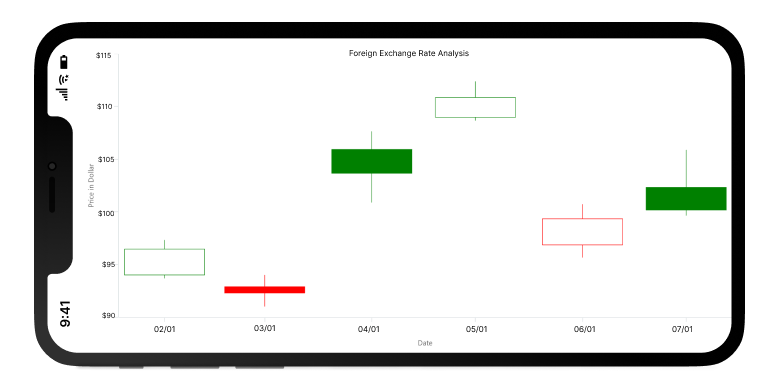
The .NET MAUI candle chart is used to represent high, low, open, and close values of stocks on the stock market. It visualizes financial data and helps users identify trends. It is often combined with line and column charts to show the close value and trading volume. The candle chart supports interactive features such as zooming and panning, trackball, tooltips, and selection.
.NET MAUI candle chart documentation
Key features

Hollow and filled
Configure the hollow and filled candle types in the .NET MAUI candle chart to customize the view of stock data.

Bull and bear
Customize the bull and bear colors used in the .NET MAUI candle chart.
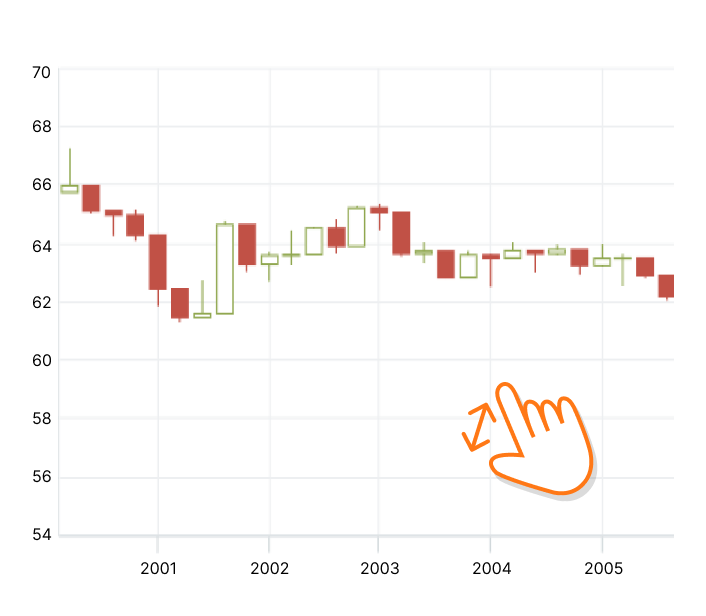
Zooming and scrolling
The .NET MAUI candle Chart supports zooming and panning when dealing with large amounts of data to visualize data points in any region.
Code example
Easily get started with the candle chart using a few simple lines of XAML and C# code, as demonstrated below.
<ContentPage xmlns="http://schemas.microsoft.com/dotnet/2021/maui"
        xmlns:x="http://schemas.microsoft.com/winfx/2009/xaml"
        x:Class="ChartExample.MainPage"
        xmlns:local="using:ChartExample"
        xmlns:chart="clr-namespace:Syncfusion.Maui.Charts;assembly=Syncfusion.Maui.Charts">

    <Grid>
        <chart:SfCartesianChart HorizontalOptions="FillAndExpand" VerticalOptions="FillAndExpand">
            <!--Setting BindingContext-->
            <chart:SfCartesianChart.BindingContext>
                <local:ViewModel/>
            </chart:SfCartesianChart.BindingContext>

            <!--Initialize the horizontal axis for the .NET MAUI Cartesian Chart.-->
            <chart:SfCartesianChart.XAxes>
                <chart:CategoryAxis/>
            </chart:SfCartesianChart.XAxes>

            <!--Initialize the vertical axis for the .NET MAUI Cartesian Chart.-->
            <chart:SfCartesianChart.YAxes>
                <chart:NumericalAxis/>
            </chart:SfCartesianChart.YAxes>

            <!--Adding Candle series to the .NET MAUI Cartesian Chart.-->
            <chart:CandleSeries
                        ItemsSource="{Binding Data}"
                        XBindingPath="Month"
                        High="High" Low="Low"
                        Open="Open" Close="Close">
            </chart:CandleSeries>
        </chart:SfCartesianChart>
    </Grid>
</ContentPage>
public class Model
{
public string Month { get; set; }
public double High { get; set; }
public double Low { get; set; }
public double Open { get; set; }
public double Close { get; set; }
public Model(string xValue, double high, double low, double open, double close)
{
Month = xValue;
High = high;
Low = low;
Open = open;
Close = close;
}
}
public class ViewModel
{
public ObservableCollection<Model> Data { get; set; }
public ViewModel()
{
Data = new ObservableCollection<Model>()
{
new Model("Jan",97.33,93.69,94.02,96.47 ),
new Model("Feb",106.0237,98.0237,104.91,102.31),
new Model("Mar",107.65,104.89,105.93,105.67),
new Model("Apr",112.39,108.66,108.97,109.85),
new Model("May",100.73,95.67,95.87,100.35),
};
}
}Learning resources


.NET MAUI Candle Chart User Guide
Learn about all the options for customizing the .NET MAUI candle chart.
