Overview
Trendlines help explain the overall direction of data by fitting calculated values on top of a series. They reduce noise, expose long-term movement, and make forecasting easier. You can add multiple trendlines to any supported series and configure their style with a few properties.
Types
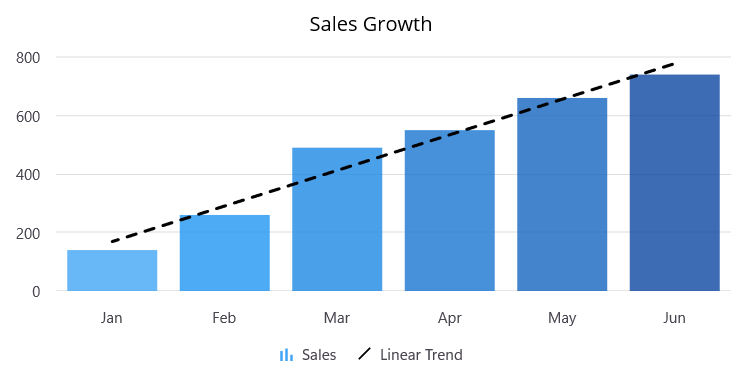
Linear
A linear trendline is a straight line used with simple linear data sets. It usually shows something increasing or decreasing at a steady rate.
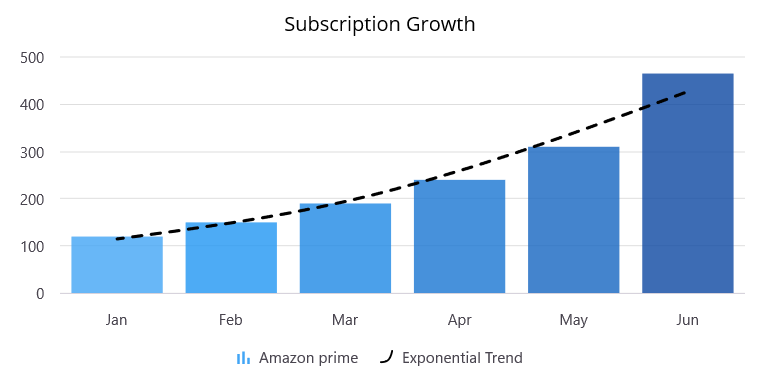
Exponential
An exponential trendline is a curved line used when data values rise or fall at increasingly higher rates. If your data contains zero or negative values, you cannot create an exponential trendline.
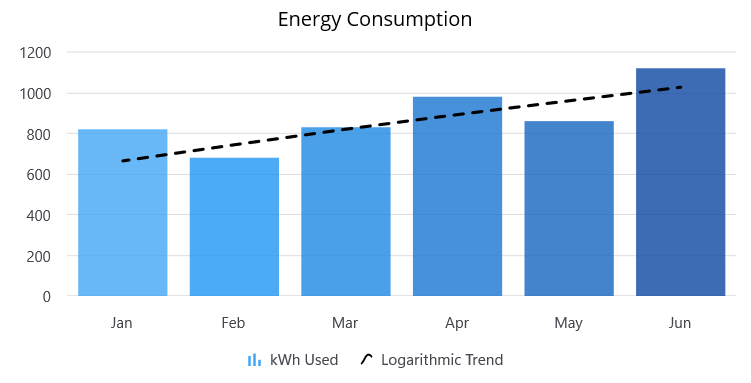
Logarithmic
A logarithmic trendline is a curved line that is most useful when the rate of change in the data increases or decreases rapidly and then levels out. It can use either negative or positive values.
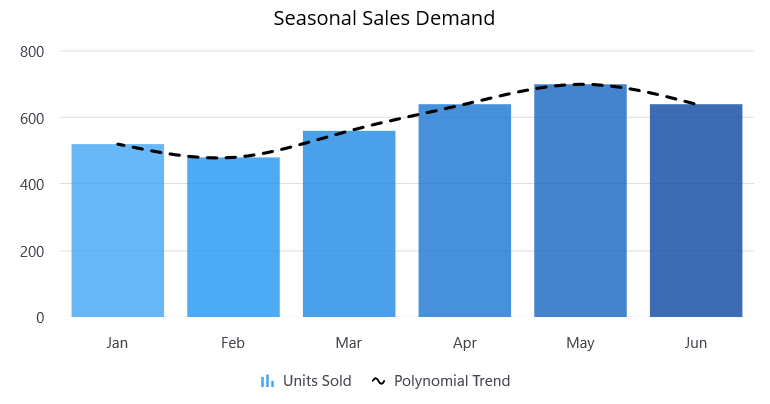
Polynomial
A polynomial trendline is a curved line used when data fluctuates. The polynomial order can be determined by the number of fluctuations in the data or by how many bends appear in the curve.
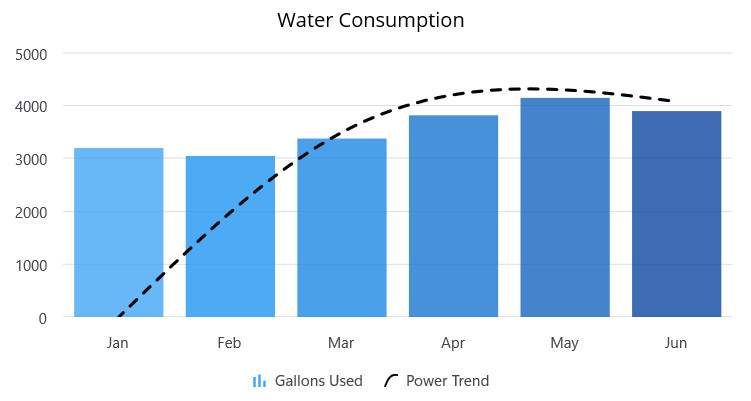
Power
A power trendline is a curved line best used with data sets comparing measurements that increase at a specific rate.
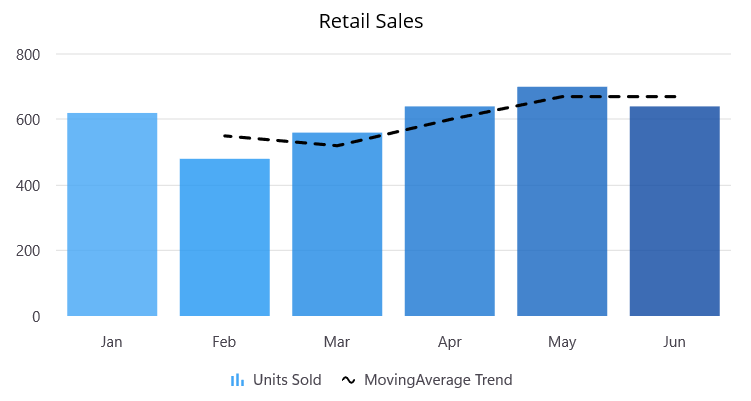
Moving average
A moving average trendline is a smoothed line that averages values across a fixed window, making the underlying direction easier to read when the series has short-term spikes.
Supporting features
Markers
Show or hide trendline markers, choose a built-in shape, and adjust the marker size so key points are easy to spot.
Forecast
Extend a trendline forward or backward by setting a forecast value. This helps visualize projected values beyond the current data range.
Legend
The legend displays each trendline with its icon and label, making it easy to identify which line represents which calculation in the chart.
Trackball
Trendline values appear in the trackball tooltip, so users can see the exact projected value at any point they touch on the chart.
Our Customers Love Us


See Real Success Stories
Developers around the world trust Syncfusion’s Essential Studio to simplify complex projects and speed up delivery. With a vast library of UI controls, powerful SDKs, and reliable support, Essential Studio helps teams build enterprise-ready applications with confidence.
Read Our Customer StoriesIndustry
Software development
75% Cost reduction
50% Faster development
Industry
Utilities (oil and gas)
450+ hours saved
Streamlined processes and hours of development effort saved.
Advanced, flexible features
Empowered users through robust and versatile functionality.
Industry
Software and technology
1000+ of hours saved
Accelerated development with enterprise-ready UI components.
Efficient file management
Streamlined workflows with document libraries without building them from scratch.
Industry
Software and technology
2 Years of delay avoided
Two years of delays prevented with proactive planning.
On-time delivery
Projects delivered on schedule using trusted controls.
Industry
IT services and IT consulting
Improved performance
Large datasets handled with easy customization and quick debugging.
Highly customizable
Plug-and-play controls with quick template integration.
Industry
Professional services
Instant access
Quick availability of features and resources.
Reduced dependencies
Fewer dependencies for faster development.